What if you invested $1,000 in 20+ Year Treasury (TLT) in 2002? (Inflation-Adjusted)
TLT · Bond · Adjusted to 2026 dollars using BLS CPI-U data
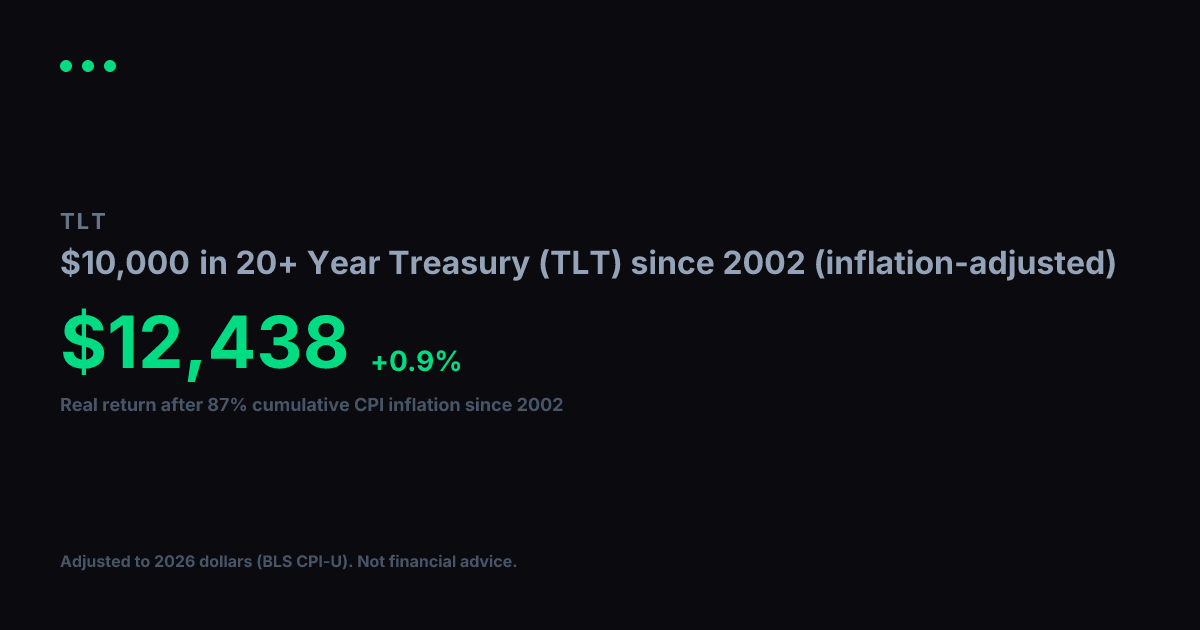
View nominal (non-adjusted) version20+ Year Treasury (TLT) turned $1,000 into $2,364 between 2002 and today. Impressive on paper, but inflation over that span came to 87% (BLS CPI-U). Adjusted for that erosion in purchasing power, your real gain in constant 2002 dollars is $1,264, which works out to a +1.0% annualized real growth rate over 25 years.
Nominal final value
$2,364
+136.4% total return
Real value (2002 dollars)
$1,264
+26.4% real total return
Real annualized return
+1.0%
vs. +3.6% nominal annualized
Year-by-Year (Inflation-Adjusted)
$1,000 in 20+ Year Treasury (TLT) since 2002, values in constant 2002 dollars
| Year | Nominal Value | Real Value (2002 $) |
|---|---|---|
| 2002 | $1,000 | $1,000 |
| 2003 | $1,091 | $1,068 |
| 2004 | $1,136 | $1,081 |
| 2005 | $1,255 | $1,154 |
| 2006 | $1,298 | $1,160 |
| 2007 | $1,312 | $1,137 |
| 2008 | $1,493 | $1,245 |
| 2009 | $1,702 | $1,429 |
| 2010 | $1,572 | $1,287 |
| 2011 | $1,618 | $1,272 |
| 2012 | $2,229 | $1,717 |
| 2013 | $2,218 | $1,672 |
| 2014 | $2,109 | $1,568 |
| 2015 | $2,774 | $2,062 |
| 2016 | $2,619 | $1,919 |
| 2017 | $2,530 | $1,813 |
| 2018 | $2,651 | $1,843 |
| 2019 | $2,706 | $1,838 |
| 2020 | $3,313 | $2,215 |
| 2021 | $3,503 | $2,229 |
| 2022 | $3,332 | $1,942 |
| 2023 | $2,567 | $1,441 |
| 2024 | $2,396 | $1,307 |
| 2025 | $2,265 | $1,211 |
| 2026 | $2,348 | $1,256 |
Inflation adjustment uses BLS CPI-U annual data, deflated to 2026 dollars. Nominal stock data from Yahoo Finance (split-adjusted closing prices). Real values are expressed in constant 2002 purchasing-power dollars. For informational and educational purposes only. Not financial advice. Past performance does not guarantee future results. See our methodology and full disclaimer.