What if you invested $1,000 in 20+ Year Treasury (TLT) in 2005? (Inflation-Adjusted)
TLT · Bond · Adjusted to 2026 dollars using BLS CPI-U data
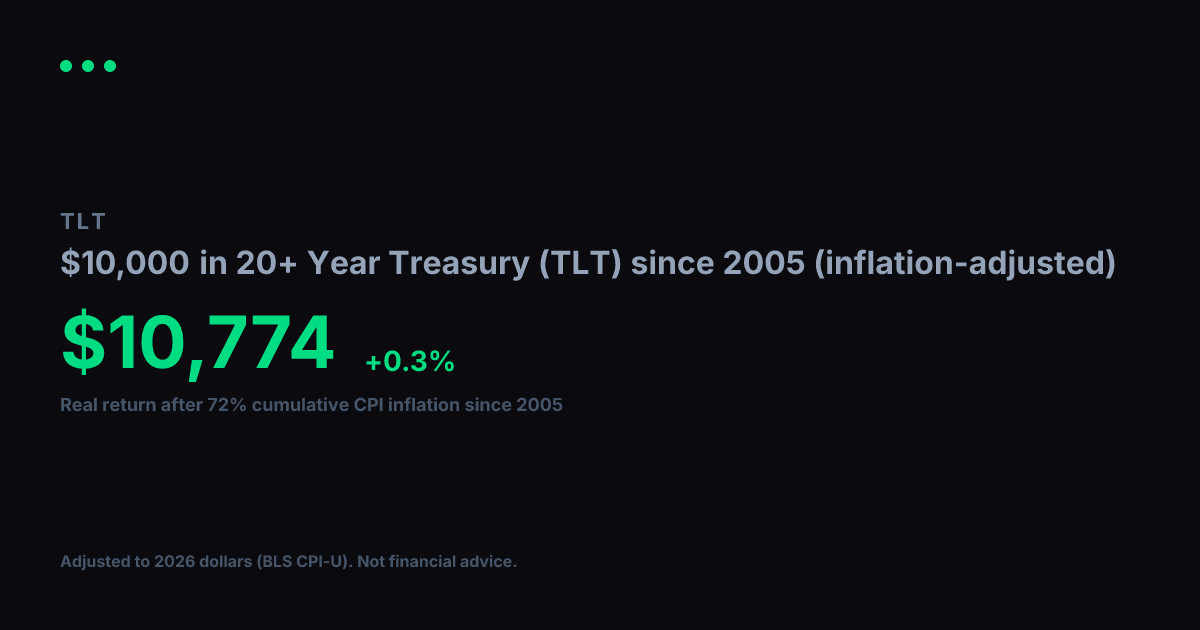
View nominal (non-adjusted) versionUsing BLS CPI-U data, cumulative inflation from 2005 to 2026 totals 72%. Your $1,000 in 20+ Year Treasury (TLT) grew to $1,884 in raw dollar terms, but in real purchasing power terms that gain is equivalent to $1,095 in constant 2005 dollars. That reflects a +0.4% per year real annualized return after accounting for price changes over 22 years.
Nominal final value
$1,884
+88.4% total return
Real value (2005 dollars)
$1,095
+9.5% real total return
Real annualized return
+0.4%
vs. +3% nominal annualized
Year-by-Year (Inflation-Adjusted)
$1,000 in 20+ Year Treasury (TLT) since 2005, values in constant 2005 dollars
| Year | Nominal Value | Real Value (2005 $) |
|---|---|---|
| 2005 | $1,000 | $1,000 |
| 2006 | $1,035 | $1,004 |
| 2007 | $1,045 | $985 |
| 2008 | $1,189 | $1,079 |
| 2009 | $1,356 | $1,238 |
| 2010 | $1,253 | $1,114 |
| 2011 | $1,289 | $1,102 |
| 2012 | $1,776 | $1,487 |
| 2013 | $1,767 | $1,449 |
| 2014 | $1,681 | $1,358 |
| 2015 | $2,210 | $1,786 |
| 2016 | $2,087 | $1,662 |
| 2017 | $2,016 | $1,571 |
| 2018 | $2,112 | $1,596 |
| 2019 | $2,156 | $1,592 |
| 2020 | $2,640 | $1,919 |
| 2021 | $2,791 | $1,931 |
| 2022 | $2,655 | $1,683 |
| 2023 | $2,045 | $1,249 |
| 2024 | $1,909 | $1,132 |
| 2025 | $1,804 | $1,049 |
| 2026 | $1,871 | $1,088 |
Inflation adjustment uses BLS CPI-U annual data, deflated to 2026 dollars. Nominal stock data from Yahoo Finance (split-adjusted closing prices). Real values are expressed in constant 2005 purchasing-power dollars. For informational and educational purposes only. Not financial advice. Past performance does not guarantee future results. See our methodology and full disclaimer.