What if you invested $1,000 in 20+ Year Treasury (TLT) in 2010? (Inflation-Adjusted)
TLT · Bond · Adjusted to 2026 dollars using BLS CPI-U data
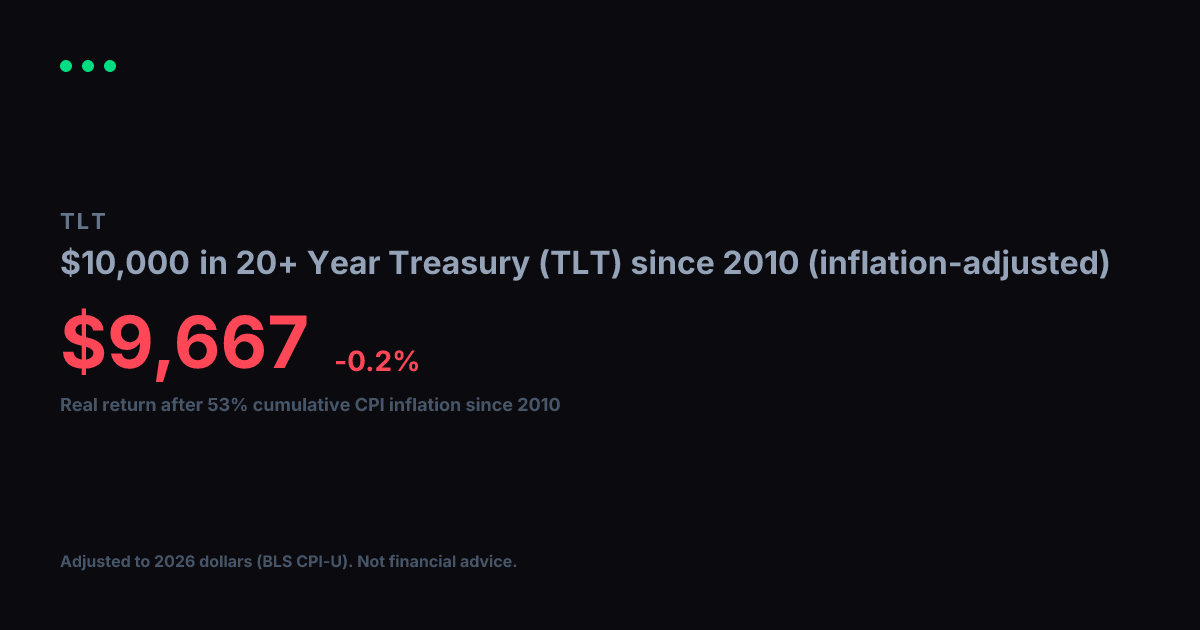
View nominal (non-adjusted) version20+ Year Treasury (TLT) turned $1,000 into $1,503 between 2010 and today. Impressive on paper, but inflation over that span came to 53% (BLS CPI-U). Adjusted for that erosion in purchasing power, your real gain in constant 2010 dollars is $983, which works out to a -0.1% annualized real growth rate over 17 years.
Nominal final value
$1,503
+50.3% total return
Real value (2010 dollars)
$983
-1.7% real total return
Real annualized return
-0.1%
vs. +2.5% nominal annualized
Year-by-Year (Inflation-Adjusted)
$1,000 in 20+ Year Treasury (TLT) since 2010, values in constant 2010 dollars
| Year | Nominal Value | Real Value (2010 $) |
|---|---|---|
| 2010 | $1,000 | $1,000 |
| 2011 | $1,029 | $988 |
| 2012 | $1,418 | $1,334 |
| 2013 | $1,410 | $1,300 |
| 2014 | $1,341 | $1,219 |
| 2015 | $1,764 | $1,603 |
| 2016 | $1,666 | $1,491 |
| 2017 | $1,609 | $1,409 |
| 2018 | $1,686 | $1,432 |
| 2019 | $1,721 | $1,429 |
| 2020 | $2,107 | $1,721 |
| 2021 | $2,228 | $1,733 |
| 2022 | $2,119 | $1,510 |
| 2023 | $1,633 | $1,120 |
| 2024 | $1,524 | $1,016 |
| 2025 | $1,440 | $941 |
| 2026 | $1,493 | $976 |
Inflation adjustment uses BLS CPI-U annual data, deflated to 2026 dollars. Nominal stock data from Yahoo Finance (split-adjusted closing prices). Real values are expressed in constant 2010 purchasing-power dollars. For informational and educational purposes only. Not financial advice. Past performance does not guarantee future results. See our methodology and full disclaimer.