What if you invested $1,000 in 20+ Year Treasury (TLT) in 2015? (Inflation-Adjusted)
TLT · Bond · Adjusted to 2026 dollars using BLS CPI-U data
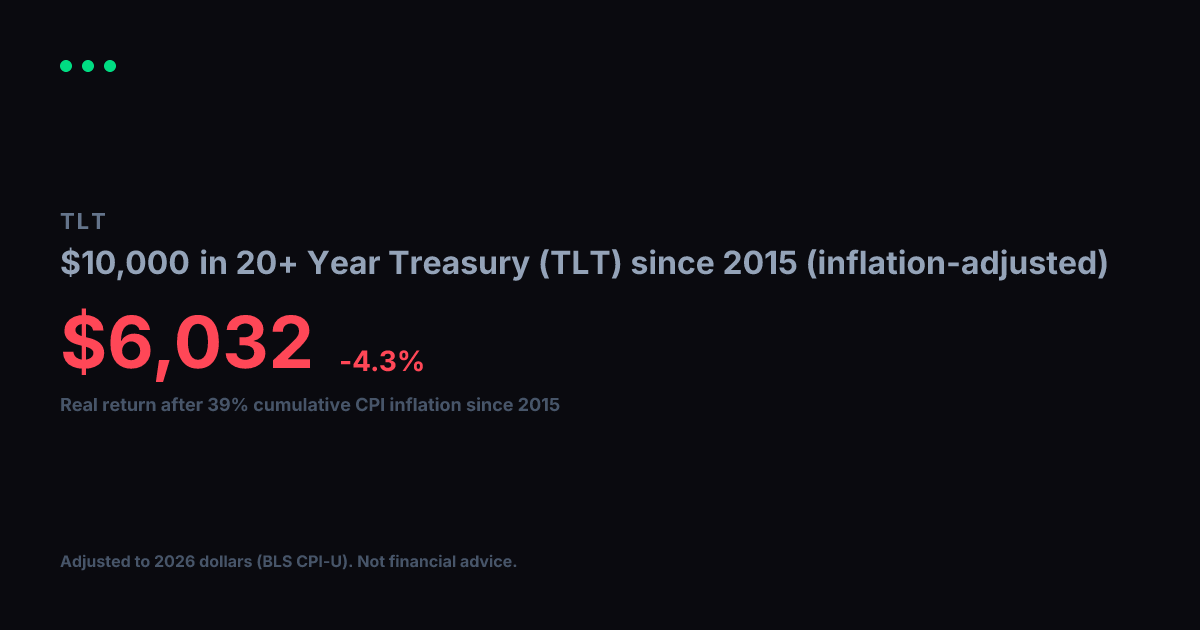
View nominal (non-adjusted) versionNominal returns can be misleading over long periods. $1,000 in 20+ Year Treasury (TLT) in 2015 became $852 by 2026. Over those 12 years, cumulative CPI inflation reached 39% (BLS CPI-U). Restating the return in constant purchasing power, the real value of your gain in 2015 dollars is $613, a real annualized return of -4.1%.
Nominal final value
$852
-14.8% total return
Real value (2015 dollars)
$613
-38.7% real total return
Real annualized return
-4.1%
vs. -1.4% nominal annualized
Year-by-Year (Inflation-Adjusted)
$1,000 in 20+ Year Treasury (TLT) since 2015, values in constant 2015 dollars
| Year | Nominal Value | Real Value (2015 $) |
|---|---|---|
| 2015 | $1,000 | $1,000 |
| 2016 | $944 | $931 |
| 2017 | $912 | $879 |
| 2018 | $956 | $894 |
| 2019 | $976 | $891 |
| 2020 | $1,194 | $1,074 |
| 2021 | $1,263 | $1,081 |
| 2022 | $1,201 | $942 |
| 2023 | $925 | $699 |
| 2024 | $864 | $634 |
| 2025 | $816 | $587 |
| 2026 | $847 | $609 |
Inflation adjustment uses BLS CPI-U annual data, deflated to 2026 dollars. Nominal stock data from Yahoo Finance (split-adjusted closing prices). Real values are expressed in constant 2015 purchasing-power dollars. For informational and educational purposes only. Not financial advice. Past performance does not guarantee future results. See our methodology and full disclaimer.