What if you invested $1,000 in 3M in 2010? (Inflation-Adjusted)
MMM · Industrial · Adjusted to 2026 dollars using BLS CPI-U data
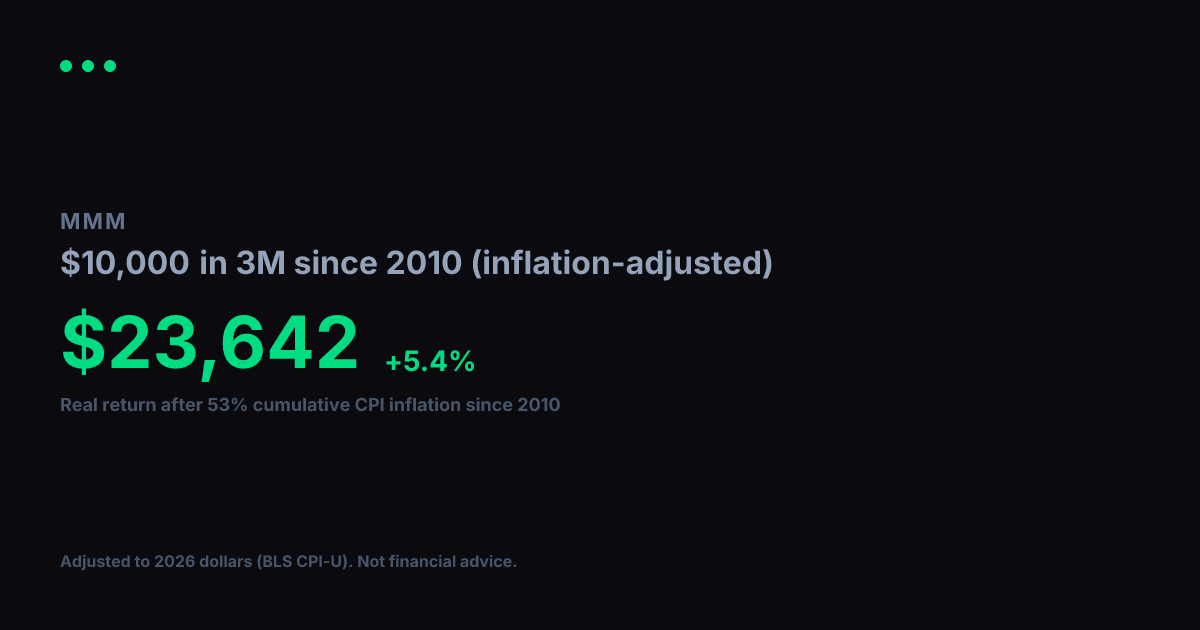
View nominal (non-adjusted) version3M turned $1,000 into $3,924 between 2010 and today. Impressive on paper, but inflation over that span came to 53% (BLS CPI-U). Adjusted for that erosion in purchasing power, your real gain in constant 2010 dollars is $2,565, which works out to a +5.8% annualized real growth rate over 17 years.
Nominal final value
$3,924
+292.4% total return
Real value (2010 dollars)
$2,565
+156.5% real total return
Real annualized return
+5.8%
vs. +8.6% nominal annualized
Year-by-Year (Inflation-Adjusted)
$1,000 in 3M since 2010, values in constant 2010 dollars
| Year | Nominal Value | Real Value (2010 $) |
|---|---|---|
| 2010 | $1,000 | $1,000 |
| 2011 | $1,120 | $1,076 |
| 2012 | $1,134 | $1,067 |
| 2013 | $1,350 | $1,244 |
| 2014 | $1,760 | $1,599 |
| 2015 | $2,282 | $2,073 |
| 2016 | $2,179 | $1,951 |
| 2017 | $2,590 | $2,269 |
| 2018 | $3,799 | $3,228 |
| 2019 | $3,118 | $2,588 |
| 2020 | $2,553 | $2,086 |
| 2021 | $2,932 | $2,280 |
| 2022 | $2,859 | $2,037 |
| 2023 | $2,066 | $1,418 |
| 2024 | $1,796 | $1,197 |
| 2025 | $3,585 | $2,343 |
| 2026 | $3,676 | $2,403 |
Inflation adjustment uses BLS CPI-U annual data, deflated to 2026 dollars. Nominal stock data from Yahoo Finance (split-adjusted closing prices). Real values are expressed in constant 2010 purchasing-power dollars. For informational and educational purposes only. Not financial advice. Past performance does not guarantee future results. See our methodology and full disclaimer.