What if you invested $1,000 in Accenture in 2005? (Inflation-Adjusted)
ACN · Technology · Adjusted to 2026 dollars using BLS CPI-U data
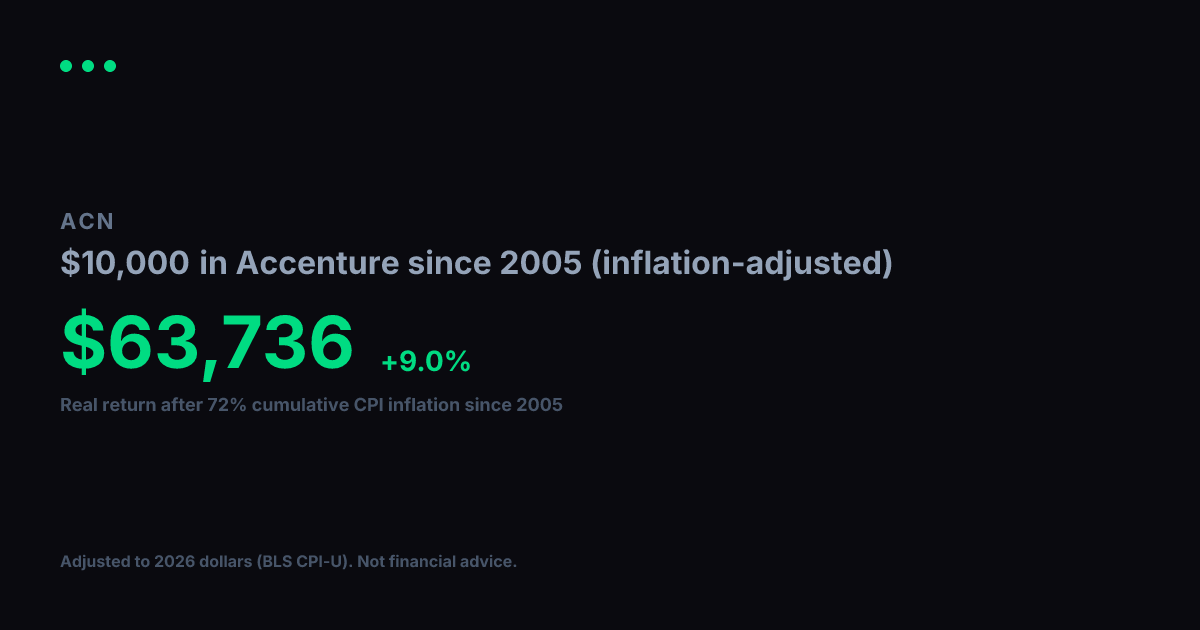
View nominal (non-adjusted) versionUsing BLS CPI-U data, cumulative inflation from 2005 to 2026 totals 72%. Your $1,000 in Accenture grew to $10,638 in raw dollar terms, but in real purchasing power terms that gain is equivalent to $6,185 in constant 2005 dollars. That reflects a +8.7% per year real annualized return after accounting for price changes over 22 years.
Nominal final value
$10,638
+963.8% total return
Real value (2005 dollars)
$6,185
+518.5% real total return
Real annualized return
+8.7%
vs. +11.5% nominal annualized
Year-by-Year (Inflation-Adjusted)
$1,000 in Accenture since 2005, values in constant 2005 dollars
| Year | Nominal Value | Real Value (2005 $) |
|---|---|---|
| 2005 | $1,000 | $1,000 |
| 2006 | $1,225 | $1,189 |
| 2007 | $1,483 | $1,397 |
| 2008 | $1,374 | $1,246 |
| 2009 | $1,273 | $1,162 |
| 2010 | $1,685 | $1,499 |
| 2011 | $2,156 | $1,842 |
| 2012 | $2,450 | $2,051 |
| 2013 | $3,141 | $2,575 |
| 2014 | $3,575 | $2,889 |
| 2015 | $3,857 | $3,117 |
| 2016 | $4,949 | $3,942 |
| 2017 | $5,448 | $4,244 |
| 2018 | $7,843 | $5,928 |
| 2019 | $7,629 | $5,633 |
| 2020 | $10,364 | $7,532 |
| 2021 | $12,409 | $8,585 |
| 2022 | $18,346 | $11,626 |
| 2023 | $14,698 | $8,973 |
| 2024 | $19,462 | $11,542 |
| 2025 | $20,933 | $12,170 |
| 2026 | $14,479 | $8,418 |
Inflation adjustment uses BLS CPI-U annual data, deflated to 2026 dollars. Nominal stock data from Yahoo Finance (split-adjusted closing prices). Real values are expressed in constant 2005 purchasing-power dollars. For informational and educational purposes only. Not financial advice. Past performance does not guarantee future results. See our methodology and full disclaimer.