What if you invested $1,000 in Amkor Technology in 2010? (Inflation-Adjusted)
AMKR · Technology · Adjusted to 2026 dollars using BLS CPI-U data
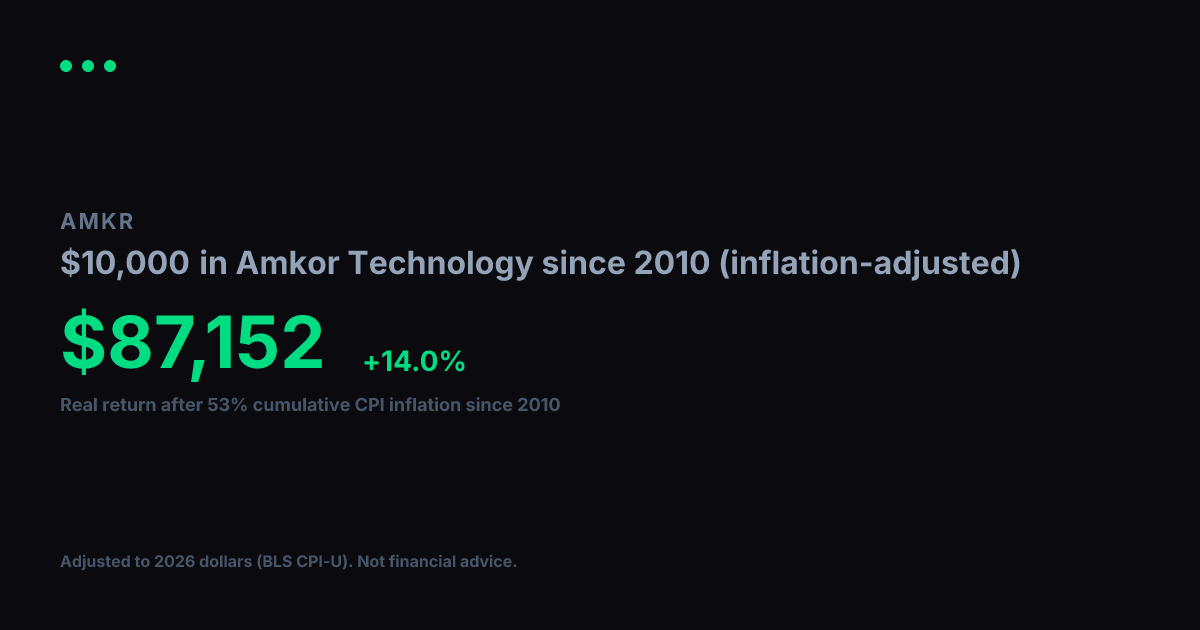
View nominal (non-adjusted) versionAmkor Technology turned $1,000 into $16,293 between 2010 and today. Impressive on paper, but inflation over that span came to 53% (BLS CPI-U). Adjusted for that erosion in purchasing power, your real gain in constant 2010 dollars is $10,649, which works out to a +15.3% annualized real growth rate over 17 years.
Nominal final value
$16,293
+1529.3% total return
Real value (2010 dollars)
$10,649
+964.9% real total return
Real annualized return
+15.3%
vs. +18.3% nominal annualized
Year-by-Year (Inflation-Adjusted)
$1,000 in Amkor Technology since 2010, values in constant 2010 dollars
| Year | Nominal Value | Real Value (2010 $) |
|---|---|---|
| 2010 | $1,000 | $1,000 |
| 2011 | $1,431 | $1,374 |
| 2012 | $1,007 | $948 |
| 2013 | $814 | $750 |
| 2014 | $931 | $846 |
| 2015 | $1,116 | $1,014 |
| 2016 | $1,079 | $966 |
| 2017 | $1,654 | $1,448 |
| 2018 | $1,768 | $1,502 |
| 2019 | $1,406 | $1,167 |
| 2020 | $1,977 | $1,615 |
| 2021 | $2,735 | $2,127 |
| 2022 | $3,908 | $2,784 |
| 2023 | $5,244 | $3,599 |
| 2024 | $5,739 | $3,826 |
| 2025 | $4,576 | $2,991 |
| 2026 | $9,114 | $5,957 |
Inflation adjustment uses BLS CPI-U annual data, deflated to 2026 dollars. Nominal stock data from Yahoo Finance (split-adjusted closing prices). Real values are expressed in constant 2010 purchasing-power dollars. For informational and educational purposes only. Not financial advice. Past performance does not guarantee future results. See our methodology and full disclaimer.