What if you invested $1,000 in Apple in 2000? (Inflation-Adjusted)
AAPL · Technology · Adjusted to 2026 dollars using BLS CPI-U data
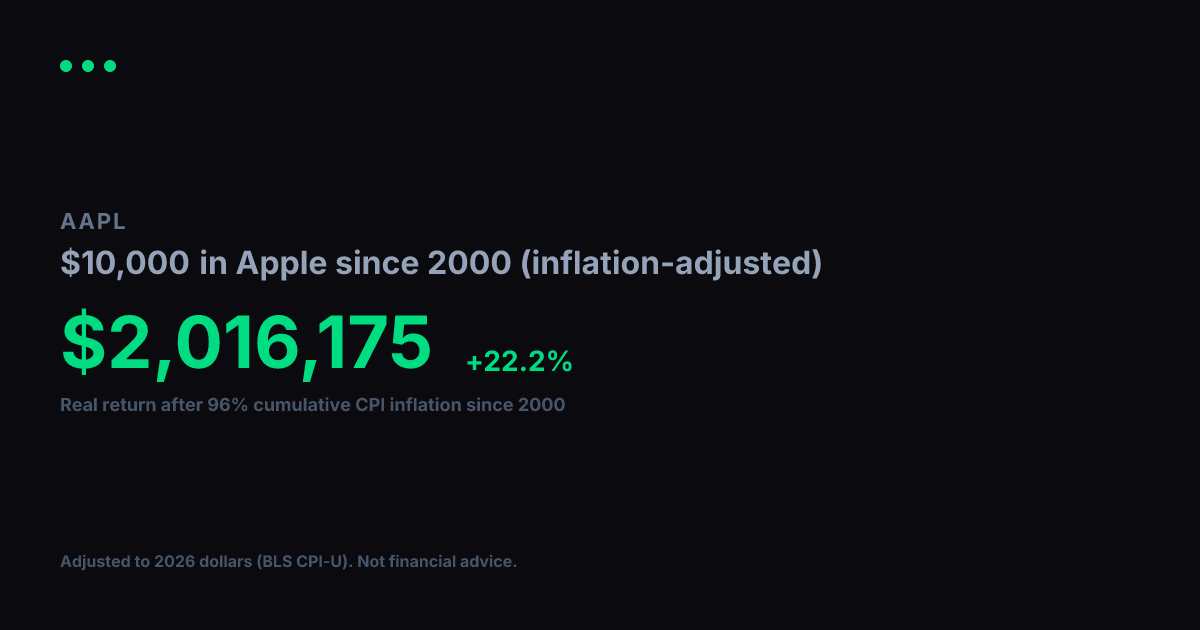
View nominal (non-adjusted) versionA $1,000 investment in Apple in 2000 grew to $372,671 in nominal terms. But 2000 dollars had 96% more purchasing power than today. After adjusting for cumulative inflation using BLS CPI-U data, the real value of that growth works out to $190,138 in constant 2000 dollars, equivalent to a +21.8% real annualized return.
Nominal final value
$372,671
+37,167% total return
Real value (2000 dollars)
$190,138
+18,914% real total return
Real annualized return
+21.8%
vs. +24.9% nominal annualized
Year-by-Year (Inflation-Adjusted)
$1,000 in Apple since 2000, values in constant 2000 dollars
| Year | Nominal Value | Real Value (2000 $) |
|---|---|---|
| 2000 | $1,000 | $1,000 |
| 2001 | $417 | $406 |
| 2002 | $477 | $455 |
| 2003 | $277 | $258 |
| 2004 | $435 | $395 |
| 2005 | $1,482 | $1,301 |
| 2006 | $2,911 | $2,480 |
| 2007 | $3,305 | $2,732 |
| 2008 | $5,219 | $4,154 |
| 2009 | $3,475 | $2,783 |
| 2010 | $7,405 | $5,780 |
| 2011 | $13,082 | $9,812 |
| 2012 | $17,599 | $12,930 |
| 2013 | $17,717 | $12,745 |
| 2014 | $19,961 | $14,156 |
| 2015 | $33,389 | $23,679 |
| 2016 | $28,214 | $19,721 |
| 2017 | $35,955 | $24,582 |
| 2018 | $50,406 | $33,433 |
| 2019 | $50,861 | $32,956 |
| 2020 | $96,001 | $61,225 |
| 2021 | $165,134 | $100,260 |
| 2022 | $220,068 | $122,384 |
| 2023 | $182,732 | $97,892 |
| 2024 | $234,833 | $122,209 |
| 2025 | $302,018 | $154,091 |
| 2026 | $333,568 | $170,188 |
Inflation adjustment uses BLS CPI-U annual data, deflated to 2026 dollars. Nominal stock data from Yahoo Finance (split-adjusted closing prices). Real values are expressed in constant 2000 purchasing-power dollars. For informational and educational purposes only. Not financial advice. Past performance does not guarantee future results. See our methodology and full disclaimer.