What if you invested $1,000 in Apple in 2010? (Inflation-Adjusted)
AAPL · Technology · Adjusted to 2026 dollars using BLS CPI-U data
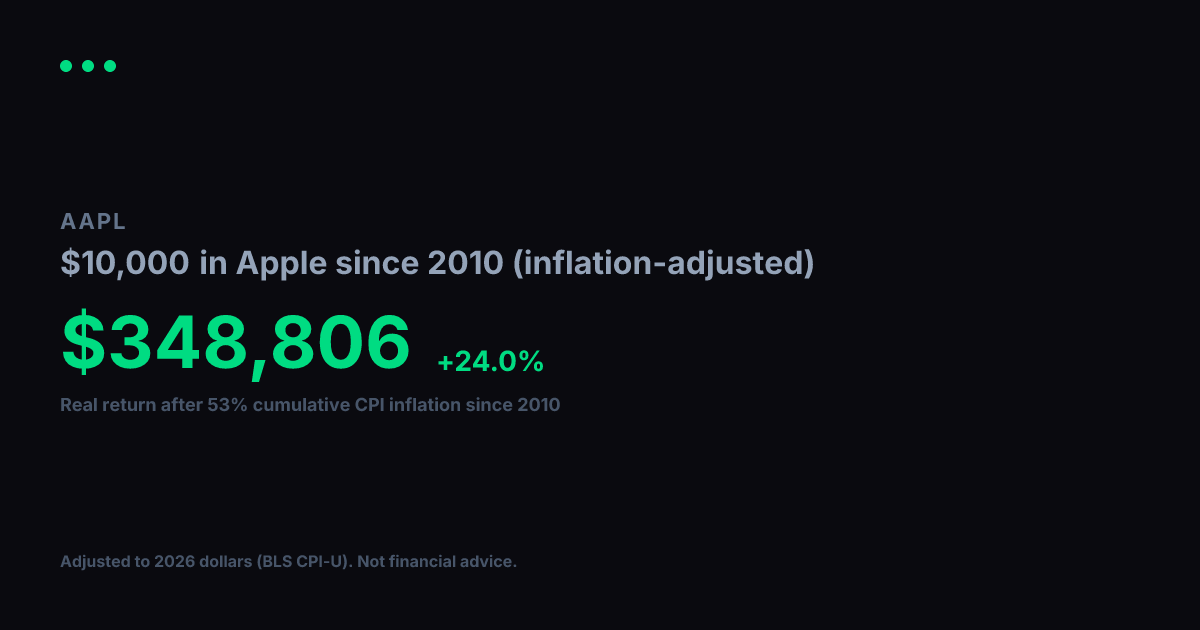
View nominal (non-adjusted) versionApple turned $1,000 into $50,329 between 2010 and today. Impressive on paper, but inflation over that span came to 53% (BLS CPI-U). Adjusted for that erosion in purchasing power, your real gain in constant 2010 dollars is $32,895, which works out to a +23.4% annualized real growth rate over 17 years.
Nominal final value
$50,329
+4932.9% total return
Real value (2010 dollars)
$32,895
+3189.5% real total return
Real annualized return
+23.4%
vs. +26.7% nominal annualized
Year-by-Year (Inflation-Adjusted)
$1,000 in Apple since 2010, values in constant 2010 dollars
| Year | Nominal Value | Real Value (2010 $) |
|---|---|---|
| 2010 | $1,000 | $1,000 |
| 2011 | $1,767 | $1,697 |
| 2012 | $2,377 | $2,237 |
| 2013 | $2,393 | $2,205 |
| 2014 | $2,696 | $2,449 |
| 2015 | $4,509 | $4,097 |
| 2016 | $3,810 | $3,412 |
| 2017 | $4,856 | $4,253 |
| 2018 | $6,807 | $5,784 |
| 2019 | $6,869 | $5,701 |
| 2020 | $12,965 | $10,592 |
| 2021 | $22,301 | $17,345 |
| 2022 | $29,720 | $21,173 |
| 2023 | $24,678 | $16,936 |
| 2024 | $31,714 | $21,143 |
| 2025 | $40,787 | $26,658 |
| 2026 | $45,048 | $29,443 |
Inflation adjustment uses BLS CPI-U annual data, deflated to 2026 dollars. Nominal stock data from Yahoo Finance (split-adjusted closing prices). Real values are expressed in constant 2010 purchasing-power dollars. For informational and educational purposes only. Not financial advice. Past performance does not guarantee future results. See our methodology and full disclaimer.