What if you invested $1,000 in Arista Networks in 2014? (Inflation-Adjusted)
ANET · Technology · Adjusted to 2026 dollars using BLS CPI-U data
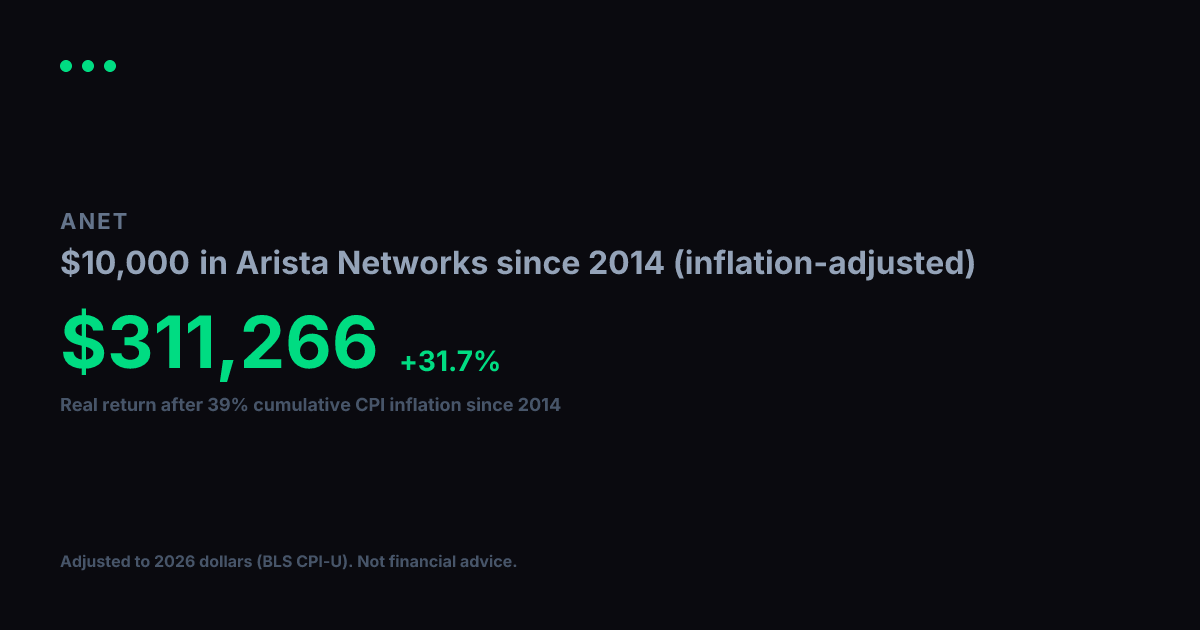
View nominal (non-adjusted) versionArista Networks turned $1,000 into $43,566 between 2014 and today. Impressive on paper, but inflation over that span came to 39% (BLS CPI-U). Adjusted for that erosion in purchasing power, your real gain in constant 2014 dollars is $31,342, which works out to a +31.4% annualized real growth rate over 13 years.
Nominal final value
$43,566
+4256.6% total return
Real value (2014 dollars)
$31,342
+3034.2% real total return
Real annualized return
+31.4%
vs. +35% nominal annualized
Year-by-Year (Inflation-Adjusted)
$1,000 in Arista Networks since 2014, values in constant 2014 dollars
| Year | Nominal Value | Real Value (2014 $) |
|---|---|---|
| 2014 | $1,000 | $1,000 |
| 2015 | $1,012 | $1,012 |
| 2016 | $962 | $948 |
| 2017 | $1,507 | $1,452 |
| 2018 | $4,421 | $4,135 |
| 2019 | $3,443 | $3,145 |
| 2020 | $3,580 | $3,219 |
| 2021 | $4,930 | $4,220 |
| 2022 | $7,970 | $6,250 |
| 2023 | $8,080 | $6,103 |
| 2024 | $16,585 | $12,170 |
| 2025 | $29,551 | $21,260 |
| 2026 | $36,349 | $26,151 |
Inflation adjustment uses BLS CPI-U annual data, deflated to 2026 dollars. Nominal stock data from Yahoo Finance (split-adjusted closing prices). Real values are expressed in constant 2014 purchasing-power dollars. For informational and educational purposes only. Not financial advice. Past performance does not guarantee future results. See our methodology and full disclaimer.