What if you invested $1,000 in AT&T in 2005? (Inflation-Adjusted)
T · Technology · Adjusted to 2026 dollars using BLS CPI-U data
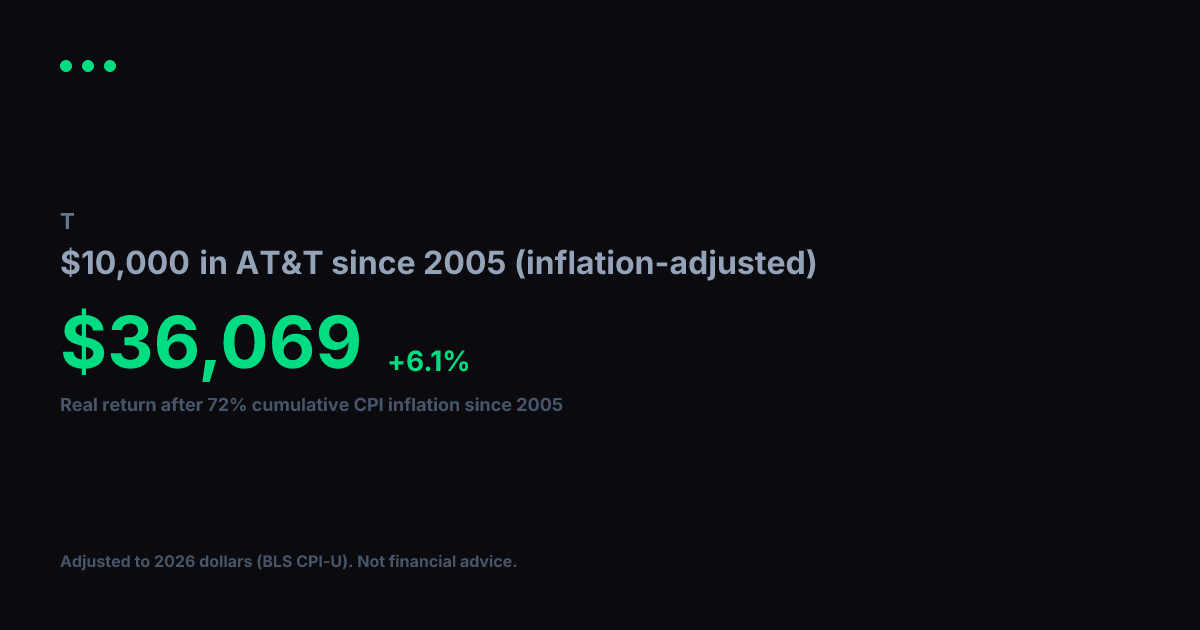
View nominal (non-adjusted) versionUsing BLS CPI-U data, cumulative inflation from 2005 to 2026 totals 72%. Your $1,000 in AT&T grew to $6,089 in raw dollar terms, but in real purchasing power terms that gain is equivalent to $3,540 in constant 2005 dollars. That reflects a +6.0% per year real annualized return after accounting for price changes over 22 years.
Nominal final value
$6,089
+508.9% total return
Real value (2005 dollars)
$3,540
+254.0% real total return
Real annualized return
+6.0%
vs. +8.6% nominal annualized
Year-by-Year (Inflation-Adjusted)
$1,000 in AT&T since 2005, values in constant 2005 dollars
| Year | Nominal Value | Real Value (2005 $) |
|---|---|---|
| 2005 | $1,000 | $1,000 |
| 2006 | $1,173 | $1,139 |
| 2007 | $1,806 | $1,701 |
| 2008 | $1,938 | $1,757 |
| 2009 | $1,330 | $1,214 |
| 2010 | $1,488 | $1,324 |
| 2011 | $1,754 | $1,499 |
| 2012 | $2,024 | $1,694 |
| 2013 | $2,561 | $2,099 |
| 2014 | $2,625 | $2,121 |
| 2015 | $2,783 | $2,249 |
| 2016 | $3,282 | $2,614 |
| 2017 | $4,084 | $3,182 |
| 2018 | $3,879 | $2,932 |
| 2019 | $3,375 | $2,492 |
| 2020 | $4,561 | $3,315 |
| 2021 | $3,811 | $2,637 |
| 2022 | $3,747 | $2,375 |
| 2023 | $4,206 | $2,568 |
| 2024 | $3,906 | $2,316 |
| 2025 | $5,544 | $3,223 |
| 2026 | $6,391 | $3,716 |
Inflation adjustment uses BLS CPI-U annual data, deflated to 2026 dollars. Nominal stock data from Yahoo Finance (split-adjusted closing prices). Real values are expressed in constant 2005 purchasing-power dollars. For informational and educational purposes only. Not financial advice. Past performance does not guarantee future results. See our methodology and full disclaimer.