What if you invested $1,000 in AT&T in 2010? (Inflation-Adjusted)
T · Technology · Adjusted to 2026 dollars using BLS CPI-U data
View nominal (non-adjusted) versionAT&T turned $1,000 into $4,091 between 2010 and today. Impressive on paper, but inflation over that span came to 53% (BLS CPI-U). Adjusted for that erosion in purchasing power, your real gain in constant 2010 dollars is $2,674, which works out to a +6.0% annualized real growth rate over 17 years.
Nominal final value
$4,091
+309.1% total return
Real value (2010 dollars)
$2,674
+167.4% real total return
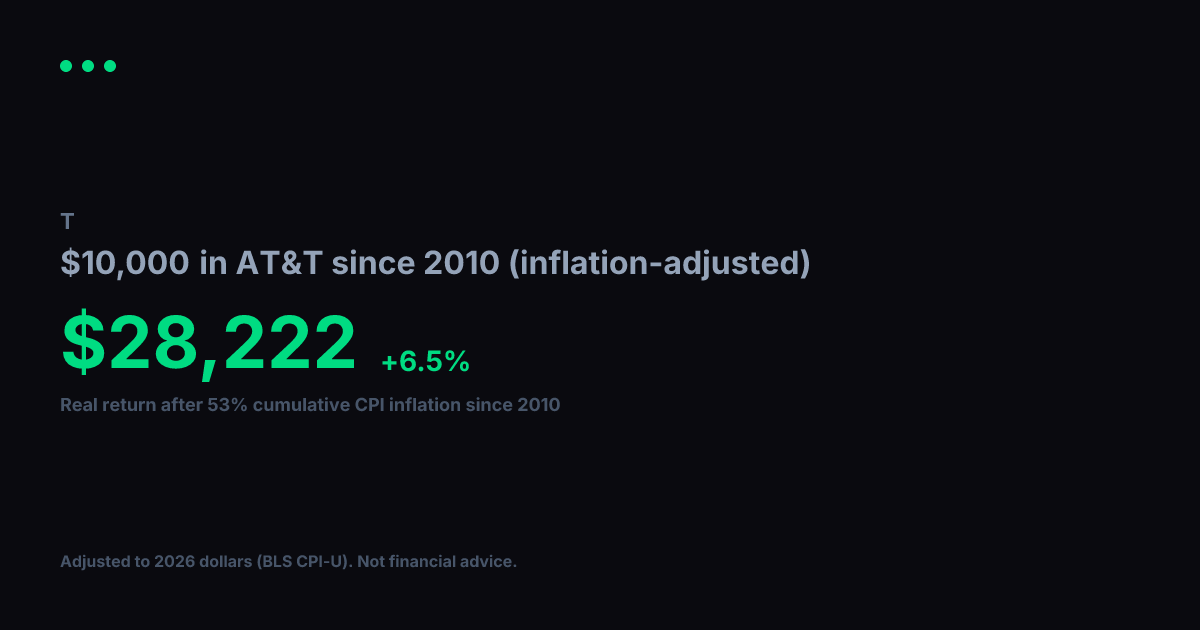
Real annualized return
+6.0%
vs. +8.7% nominal annualized
Year-by-Year (Inflation-Adjusted)
$1,000 in AT&T since 2010, values in constant 2010 dollars
| Year | Nominal Value | Real Value (2010 $) |
|---|---|---|
| 2010 | $1,000 | $1,000 |
| 2011 | $1,179 | $1,133 |
| 2012 | $1,360 | $1,280 |
| 2013 | $1,721 | $1,586 |
| 2014 | $1,764 | $1,602 |
| 2015 | $1,870 | $1,699 |
| 2016 | $2,205 | $1,974 |
| 2017 | $2,744 | $2,404 |
| 2018 | $2,607 | $2,215 |
| 2019 | $2,268 | $1,882 |
| 2020 | $3,065 | $2,504 |
| 2021 | $2,561 | $1,992 |
| 2022 | $2,518 | $1,794 |
| 2023 | $2,826 | $1,940 |
| 2024 | $2,624 | $1,750 |
| 2025 | $3,725 | $2,435 |
| 2026 | $4,294 | $2,807 |
Inflation adjustment uses BLS CPI-U annual data, deflated to 2026 dollars. Nominal stock data from Yahoo Finance (split-adjusted closing prices). Real values are expressed in constant 2010 purchasing-power dollars. For informational and educational purposes only. Not financial advice. Past performance does not guarantee future results. See our methodology and full disclaimer.