What if you invested $1,000 in Bank of America in 2010? (Inflation-Adjusted)
BAC · Financial · Adjusted to 2026 dollars using BLS CPI-U data
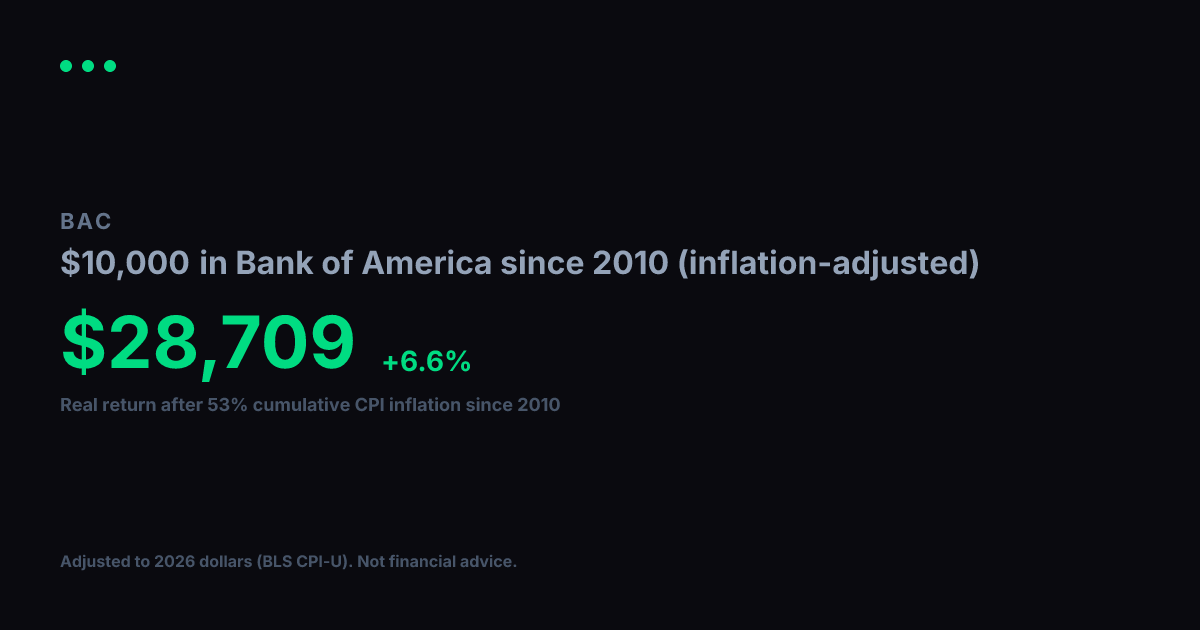
View nominal (non-adjusted) versionBank of America turned $1,000 into $4,867 between 2010 and today. Impressive on paper, but inflation over that span came to 53% (BLS CPI-U). Adjusted for that erosion in purchasing power, your real gain in constant 2010 dollars is $3,181, which works out to a +7.2% annualized real growth rate over 17 years.
Nominal final value
$4,867
+386.7% total return
Real value (2010 dollars)
$3,181
+218.1% real total return
Real annualized return
+7.2%
vs. +10% nominal annualized
Year-by-Year (Inflation-Adjusted)
$1,000 in Bank of America since 2010, values in constant 2010 dollars
| Year | Nominal Value | Real Value (2010 $) |
|---|---|---|
| 2010 | $1,000 | $1,000 |
| 2011 | $907 | $872 |
| 2012 | $473 | $446 |
| 2013 | $755 | $696 |
| 2014 | $1,121 | $1,018 |
| 2015 | $1,021 | $928 |
| 2016 | $965 | $864 |
| 2017 | $1,569 | $1,374 |
| 2018 | $2,252 | $1,914 |
| 2019 | $2,041 | $1,694 |
| 2020 | $2,407 | $1,966 |
| 2021 | $2,232 | $1,736 |
| 2022 | $3,540 | $2,522 |
| 2023 | $2,785 | $1,912 |
| 2024 | $2,753 | $1,835 |
| 2025 | $3,844 | $2,512 |
| 2026 | $4,519 | $2,953 |
Inflation adjustment uses BLS CPI-U annual data, deflated to 2026 dollars. Nominal stock data from Yahoo Finance (split-adjusted closing prices). Real values are expressed in constant 2010 purchasing-power dollars. For informational and educational purposes only. Not financial advice. Past performance does not guarantee future results. See our methodology and full disclaimer.