What if you invested $1,000 in Berkshire Hathaway in 2010? (Inflation-Adjusted)
BRK-B · Financial · Adjusted to 2026 dollars using BLS CPI-U data
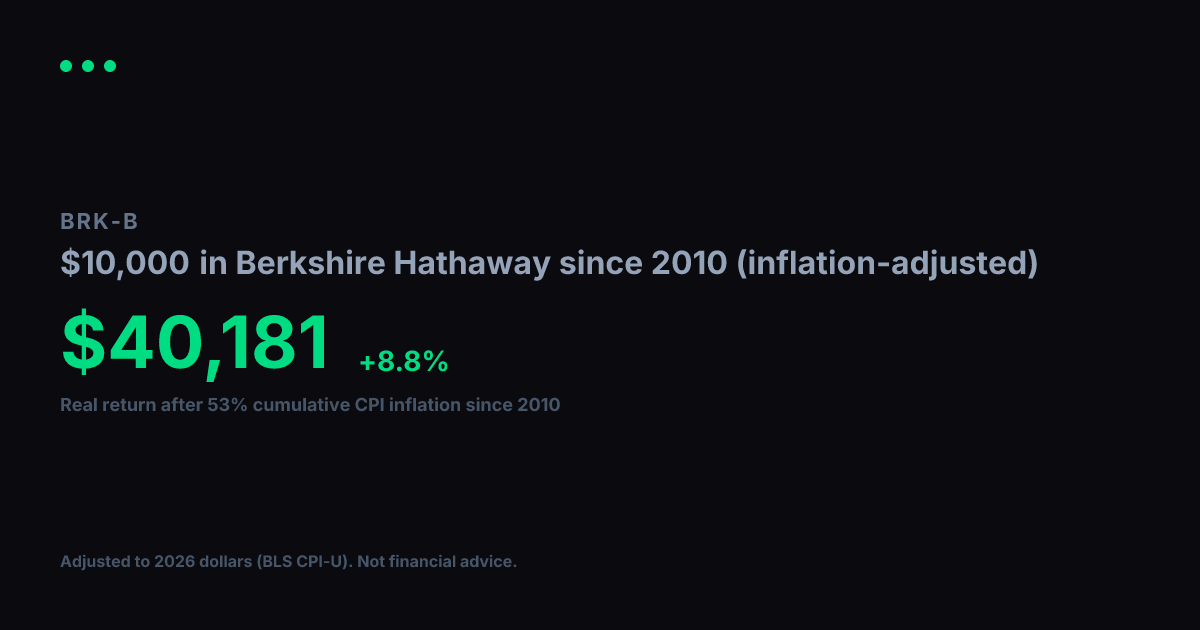
View nominal (non-adjusted) versionBerkshire Hathaway turned $1,000 into $6,547 between 2010 and today. Impressive on paper, but inflation over that span came to 53% (BLS CPI-U). Adjusted for that erosion in purchasing power, your real gain in constant 2010 dollars is $4,279, which works out to a +9.2% annualized real growth rate over 17 years.
Nominal final value
$6,547
+554.7% total return
Real value (2010 dollars)
$4,279
+327.9% real total return
Real annualized return
+9.2%
vs. +12% nominal annualized
Year-by-Year (Inflation-Adjusted)
$1,000 in Berkshire Hathaway since 2010, values in constant 2010 dollars
| Year | Nominal Value | Real Value (2010 $) |
|---|---|---|
| 2010 | $1,000 | $1,000 |
| 2011 | $1,070 | $1,028 |
| 2012 | $1,025 | $965 |
| 2013 | $1,268 | $1,169 |
| 2014 | $1,460 | $1,327 |
| 2015 | $1,883 | $1,711 |
| 2016 | $1,698 | $1,520 |
| 2017 | $2,148 | $1,881 |
| 2018 | $2,805 | $2,383 |
| 2019 | $2,689 | $2,232 |
| 2020 | $2,936 | $2,399 |
| 2021 | $2,981 | $2,319 |
| 2022 | $4,096 | $2,918 |
| 2023 | $4,076 | $2,797 |
| 2024 | $5,021 | $3,347 |
| 2025 | $6,132 | $4,008 |
| 2026 | $6,287 | $4,109 |
Inflation adjustment uses BLS CPI-U annual data, deflated to 2026 dollars. Nominal stock data from Yahoo Finance (split-adjusted closing prices). Real values are expressed in constant 2010 purchasing-power dollars. For informational and educational purposes only. Not financial advice. Past performance does not guarantee future results. See our methodology and full disclaimer.