What if you invested $1,000 in BlackRock in 2000? (Inflation-Adjusted)
BLK · Financial · Adjusted to 2026 dollars using BLS CPI-U data
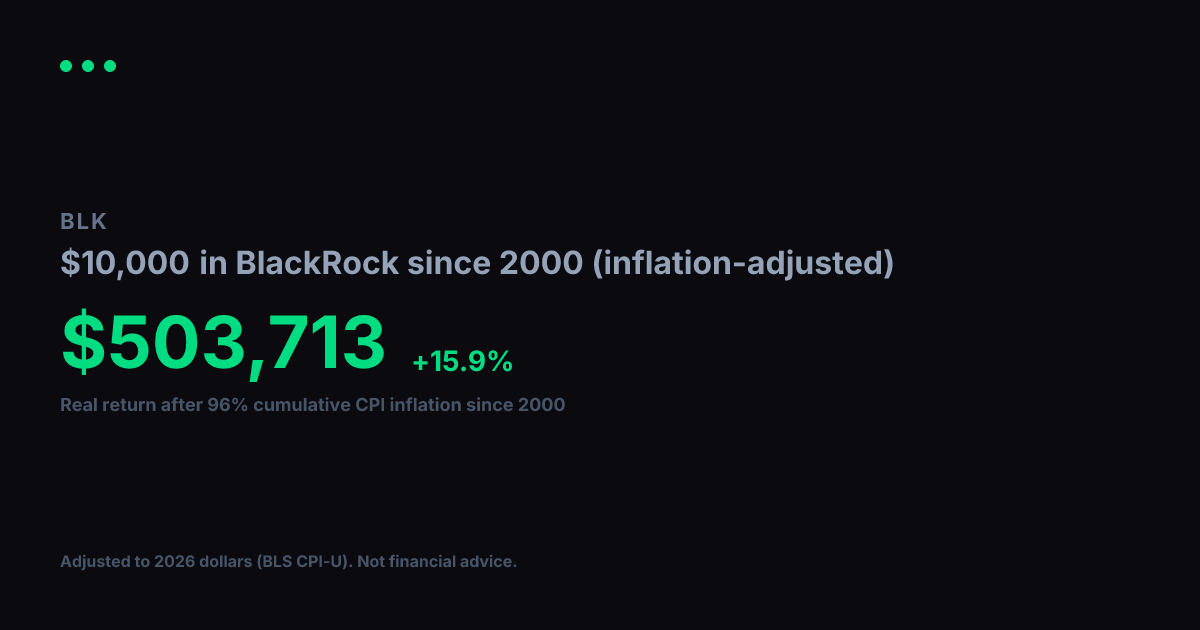
View nominal (non-adjusted) versionA $1,000 investment in BlackRock in 2000 grew to $92,326 in nominal terms. But 2000 dollars had 96% more purchasing power than today. After adjusting for cumulative inflation using BLS CPI-U data, the real value of that growth works out to $47,105 in constant 2000 dollars, equivalent to a +15.6% real annualized return.
Nominal final value
$92,326
+9132.6% total return
Real value (2000 dollars)
$47,105
+4610.5% real total return
Real annualized return
+15.6%
vs. +18.6% nominal annualized
Year-by-Year (Inflation-Adjusted)
$1,000 in BlackRock since 2000, values in constant 2000 dollars
| Year | Nominal Value | Real Value (2000 $) |
|---|---|---|
| 2000 | $1,000 | $1,000 |
| 2001 | $2,281 | $2,223 |
| 2002 | $2,457 | $2,344 |
| 2003 | $2,414 | $2,254 |
| 2004 | $3,343 | $3,036 |
| 2005 | $4,695 | $4,120 |
| 2006 | $7,875 | $6,710 |
| 2007 | $10,070 | $8,323 |
| 2008 | $13,450 | $10,705 |
| 2009 | $6,757 | $5,412 |
| 2010 | $13,550 | $10,577 |
| 2011 | $12,852 | $9,639 |
| 2012 | $12,174 | $8,944 |
| 2013 | $16,333 | $11,750 |
| 2014 | $21,302 | $15,107 |
| 2015 | $24,720 | $17,531 |
| 2016 | $23,392 | $16,350 |
| 2017 | $28,556 | $19,523 |
| 2018 | $43,915 | $29,127 |
| 2019 | $33,266 | $21,555 |
| 2020 | $43,549 | $27,774 |
| 2021 | $59,393 | $36,060 |
| 2022 | $71,073 | $39,525 |
| 2023 | $67,436 | $36,127 |
| 2024 | $70,760 | $36,824 |
| 2025 | $100,632 | $51,343 |
| 2026 | $106,843 | $54,511 |
Inflation adjustment uses BLS CPI-U annual data, deflated to 2026 dollars. Nominal stock data from Yahoo Finance (split-adjusted closing prices). Real values are expressed in constant 2000 purchasing-power dollars. For informational and educational purposes only. Not financial advice. Past performance does not guarantee future results. See our methodology and full disclaimer.