What if you invested $1,000 in Charles Schwab in 2000? (Inflation-Adjusted)
SCHW · Financial · Adjusted to 2026 dollars using BLS CPI-U data
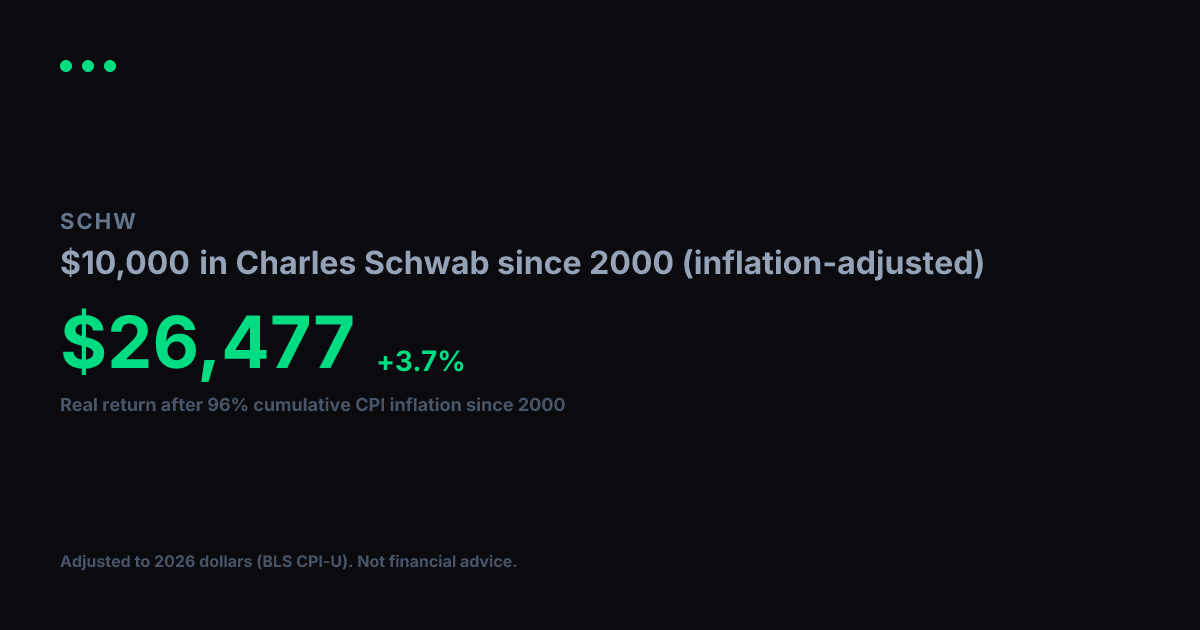
View nominal (non-adjusted) versionA $1,000 investment in Charles Schwab in 2000 grew to $5,465 in nominal terms. But 2000 dollars had 96% more purchasing power than today. After adjusting for cumulative inflation using BLS CPI-U data, the real value of that growth works out to $2,788 in constant 2000 dollars, equivalent to a +3.9% real annualized return.
Nominal final value
$5,465
+446.5% total return
Real value (2000 dollars)
$2,788
+178.8% real total return
Real annualized return
+3.9%
vs. +6.6% nominal annualized
Year-by-Year (Inflation-Adjusted)
$1,000 in Charles Schwab since 2000, values in constant 2000 dollars
| Year | Nominal Value | Real Value (2000 $) |
|---|---|---|
| 2000 | $1,000 | $1,000 |
| 2001 | $1,127 | $1,098 |
| 2002 | $615 | $587 |
| 2003 | $396 | $370 |
| 2004 | $544 | $494 |
| 2005 | $489 | $429 |
| 2006 | $648 | $552 |
| 2007 | $836 | $691 |
| 2008 | $1,044 | $831 |
| 2009 | $643 | $515 |
| 2010 | $878 | $685 |
| 2011 | $879 | $659 |
| 2012 | $576 | $423 |
| 2013 | $833 | $599 |
| 2014 | $1,266 | $898 |
| 2015 | $1,337 | $948 |
| 2016 | $1,324 | $926 |
| 2017 | $2,160 | $1,477 |
| 2018 | $2,815 | $1,867 |
| 2019 | $2,490 | $1,614 |
| 2020 | $2,465 | $1,572 |
| 2021 | $2,840 | $1,724 |
| 2022 | $4,883 | $2,716 |
| 2023 | $4,359 | $2,335 |
| 2024 | $3,603 | $1,875 |
| 2025 | $4,806 | $2,452 |
| 2026 | $6,112 | $3,119 |
Inflation adjustment uses BLS CPI-U annual data, deflated to 2026 dollars. Nominal stock data from Yahoo Finance (split-adjusted closing prices). Real values are expressed in constant 2000 purchasing-power dollars. For informational and educational purposes only. Not financial advice. Past performance does not guarantee future results. See our methodology and full disclaimer.