What if you invested $1,000 in Charles Schwab in 2005? (Inflation-Adjusted)
SCHW · Financial · Adjusted to 2026 dollars using BLS CPI-U data
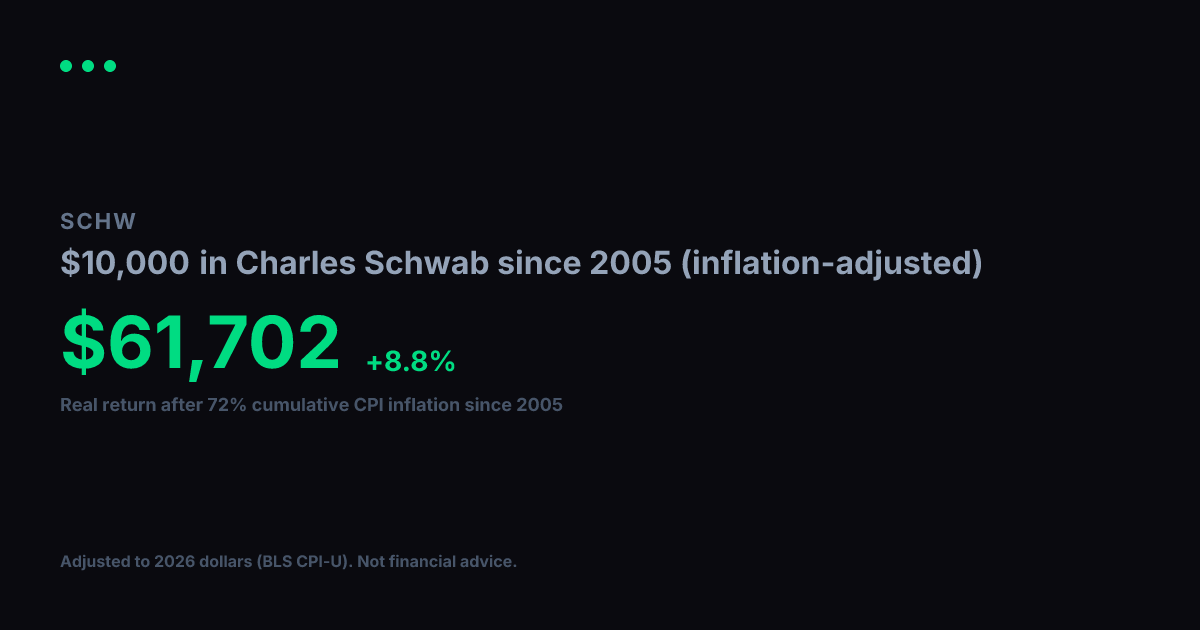
View nominal (non-adjusted) versionUsing BLS CPI-U data, cumulative inflation from 2005 to 2026 totals 72%. Your $1,000 in Charles Schwab grew to $11,176 in raw dollar terms, but in real purchasing power terms that gain is equivalent to $6,498 in constant 2005 dollars. That reflects a +9.1% per year real annualized return after accounting for price changes over 22 years.
Nominal final value
$11,176
+1017.6% total return
Real value (2005 dollars)
$6,498
+549.8% real total return
Real annualized return
+9.1%
vs. +11.8% nominal annualized
Year-by-Year (Inflation-Adjusted)
$1,000 in Charles Schwab since 2005, values in constant 2005 dollars
| Year | Nominal Value | Real Value (2005 $) |
|---|---|---|
| 2005 | $1,000 | $1,000 |
| 2006 | $1,326 | $1,287 |
| 2007 | $1,709 | $1,610 |
| 2008 | $2,134 | $1,936 |
| 2009 | $1,315 | $1,200 |
| 2010 | $1,795 | $1,597 |
| 2011 | $1,797 | $1,536 |
| 2012 | $1,179 | $987 |
| 2013 | $1,703 | $1,396 |
| 2014 | $2,589 | $2,092 |
| 2015 | $2,735 | $2,210 |
| 2016 | $2,708 | $2,157 |
| 2017 | $4,417 | $3,441 |
| 2018 | $5,757 | $4,351 |
| 2019 | $5,093 | $3,760 |
| 2020 | $5,040 | $3,663 |
| 2021 | $5,808 | $4,018 |
| 2022 | $9,987 | $6,329 |
| 2023 | $8,915 | $5,442 |
| 2024 | $7,368 | $4,369 |
| 2025 | $9,830 | $5,715 |
| 2026 | $12,500 | $7,267 |
Inflation adjustment uses BLS CPI-U annual data, deflated to 2026 dollars. Nominal stock data from Yahoo Finance (split-adjusted closing prices). Real values are expressed in constant 2005 purchasing-power dollars. For informational and educational purposes only. Not financial advice. Past performance does not guarantee future results. See our methodology and full disclaimer.