What if you invested $1,000 in China Large-Cap (FXI) in 2015? (Inflation-Adjusted)
FXI · Index · Adjusted to 2026 dollars using BLS CPI-U data
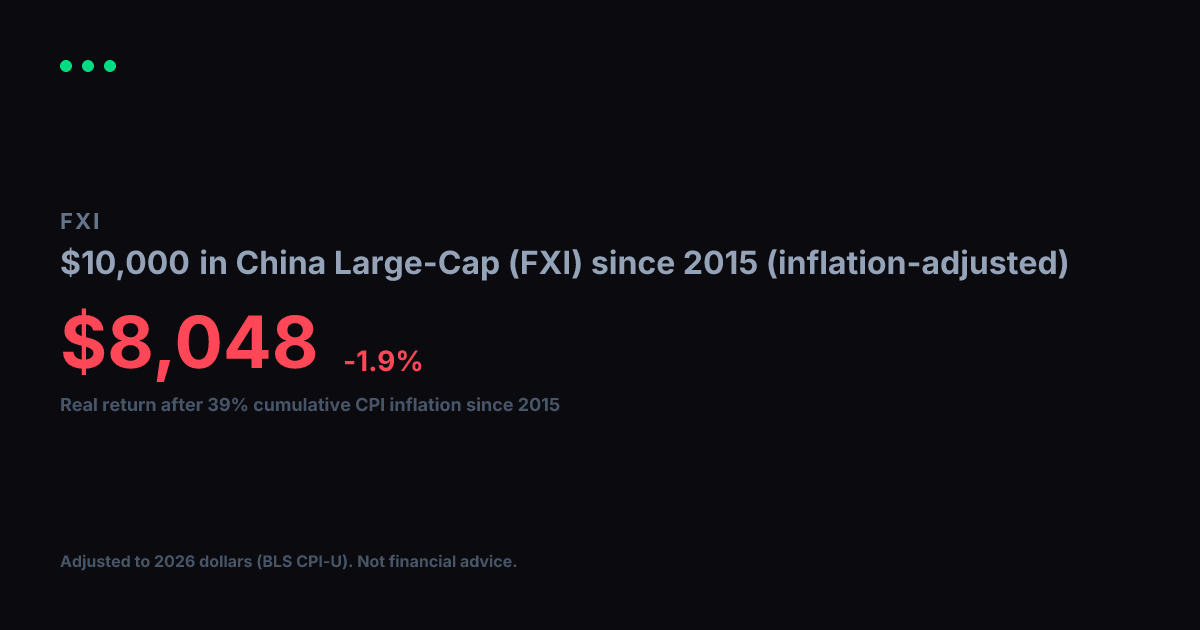
View nominal (non-adjusted) versionNominal returns can be misleading over long periods. $1,000 in China Large-Cap (FXI) in 2015 became $1,001 by 2026. Over those 12 years, cumulative CPI inflation reached 39% (BLS CPI-U). Restating the return in constant purchasing power, the real value of your gain in 2015 dollars is $720, a real annualized return of -2.8%.
Nominal final value
$1,001
+0.1% total return
Real value (2015 dollars)
$720
-28.0% real total return
Real annualized return
-2.8%
vs. +0% nominal annualized
Year-by-Year (Inflation-Adjusted)
$1,000 in China Large-Cap (FXI) since 2015, values in constant 2015 dollars
| Year | Nominal Value | Real Value (2015 $) |
|---|---|---|
| 2015 | $1,000 | $1,000 |
| 2016 | $777 | $766 |
| 2017 | $939 | $905 |
| 2018 | $1,381 | $1,291 |
| 2019 | $1,159 | $1,059 |
| 2020 | $1,099 | $988 |
| 2021 | $1,397 | $1,196 |
| 2022 | $1,089 | $854 |
| 2023 | $936 | $707 |
| 2024 | $661 | $485 |
| 2025 | $986 | $709 |
| 2026 | $1,255 | $903 |
Inflation adjustment uses BLS CPI-U annual data, deflated to 2026 dollars. Nominal stock data from Yahoo Finance (split-adjusted closing prices). Real values are expressed in constant 2015 purchasing-power dollars. For informational and educational purposes only. Not financial advice. Past performance does not guarantee future results. See our methodology and full disclaimer.