What if you invested $1,000 in Citigroup in 2010? (Inflation-Adjusted)
C · Financial · Adjusted to 2026 dollars using BLS CPI-U data
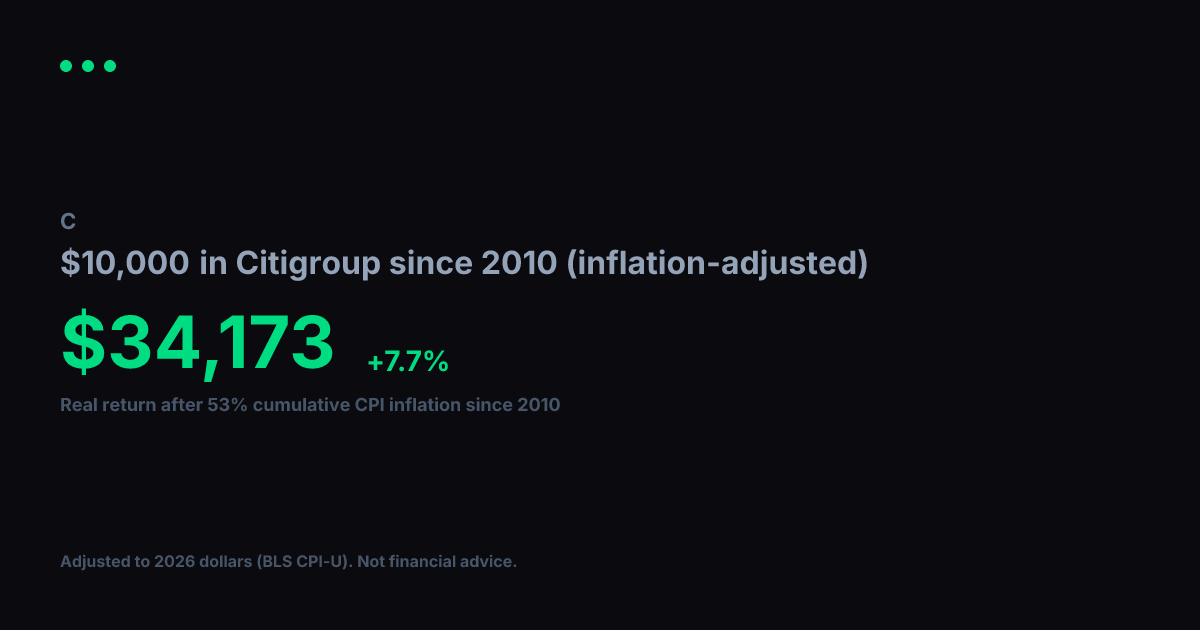
View nominal (non-adjusted) versionCitigroup turned $1,000 into $5,738 between 2010 and today. Impressive on paper, but inflation over that span came to 53% (BLS CPI-U). Adjusted for that erosion in purchasing power, your real gain in constant 2010 dollars is $3,750, which works out to a +8.3% annualized real growth rate over 17 years.
Nominal final value
$5,738
+473.8% total return
Real value (2010 dollars)
$3,750
+275.0% real total return
Real annualized return
+8.3%
vs. +11.1% nominal annualized
Year-by-Year (Inflation-Adjusted)
$1,000 in Citigroup since 2010, values in constant 2010 dollars
| Year | Nominal Value | Real Value (2010 $) |
|---|---|---|
| 2010 | $1,000 | $1,000 |
| 2011 | $1,452 | $1,395 |
| 2012 | $926 | $872 |
| 2013 | $1,273 | $1,173 |
| 2014 | $1,433 | $1,302 |
| 2015 | $1,419 | $1,290 |
| 2016 | $1,291 | $1,156 |
| 2017 | $1,709 | $1,496 |
| 2018 | $2,437 | $2,070 |
| 2019 | $2,046 | $1,698 |
| 2020 | $2,429 | $1,984 |
| 2021 | $1,969 | $1,531 |
| 2022 | $2,279 | $1,623 |
| 2023 | $1,901 | $1,304 |
| 2024 | $2,139 | $1,426 |
| 2025 | $3,216 | $2,102 |
| 2026 | $4,697 | $3,070 |
Inflation adjustment uses BLS CPI-U annual data, deflated to 2026 dollars. Nominal stock data from Yahoo Finance (split-adjusted closing prices). Real values are expressed in constant 2010 purchasing-power dollars. For informational and educational purposes only. Not financial advice. Past performance does not guarantee future results. See our methodology and full disclaimer.