What if you invested $1,000 in Coca-Cola in 2010? (Inflation-Adjusted)
KO · Consumer · Adjusted to 2026 dollars using BLS CPI-U data
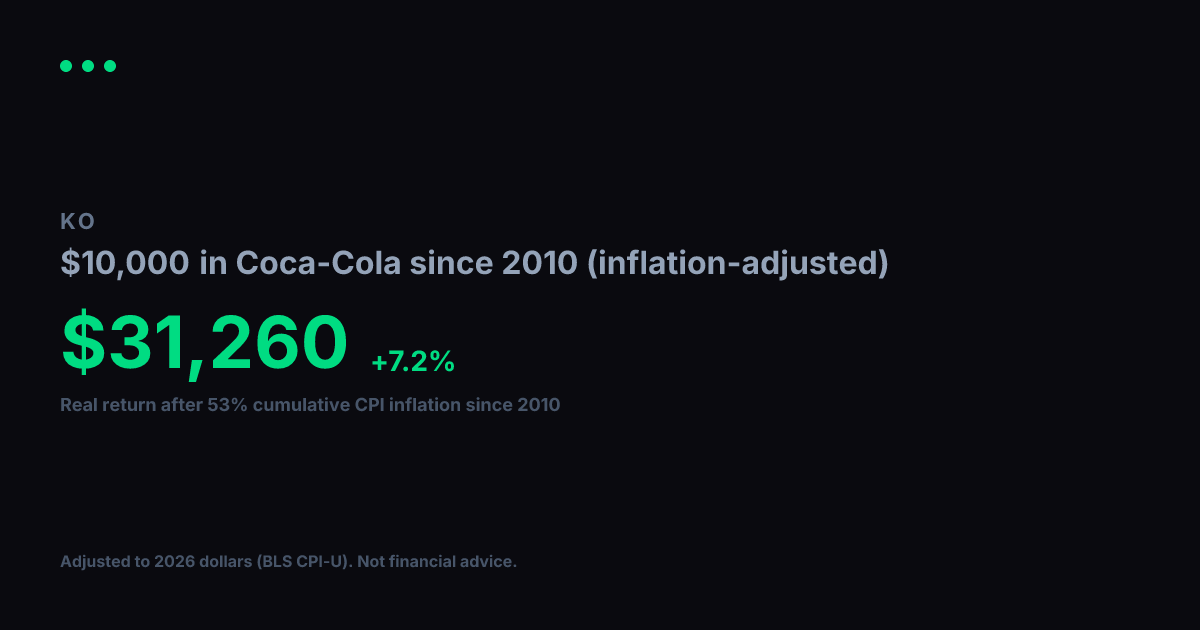
View nominal (non-adjusted) versionCoca-Cola turned $1,000 into $4,935 between 2010 and today. Impressive on paper, but inflation over that span came to 53% (BLS CPI-U). Adjusted for that erosion in purchasing power, your real gain in constant 2010 dollars is $3,225, which works out to a +7.3% annualized real growth rate over 17 years.
Nominal final value
$4,935
+393.5% total return
Real value (2010 dollars)
$3,225
+222.5% real total return
Real annualized return
+7.3%
vs. +10.1% nominal annualized
Year-by-Year (Inflation-Adjusted)
$1,000 in Coca-Cola since 2010, values in constant 2010 dollars
| Year | Nominal Value | Real Value (2010 $) |
|---|---|---|
| 2010 | $1,000 | $1,000 |
| 2011 | $1,195 | $1,148 |
| 2012 | $1,321 | $1,243 |
| 2013 | $1,498 | $1,381 |
| 2014 | $1,565 | $1,422 |
| 2015 | $1,755 | $1,594 |
| 2016 | $1,890 | $1,693 |
| 2017 | $1,890 | $1,655 |
| 2018 | $2,237 | $1,900 |
| 2019 | $2,340 | $1,943 |
| 2020 | $2,930 | $2,394 |
| 2021 | $2,498 | $1,943 |
| 2022 | $3,265 | $2,326 |
| 2023 | $3,379 | $2,319 |
| 2024 | $3,381 | $2,254 |
| 2025 | $3,718 | $2,430 |
| 2026 | $4,511 | $2,949 |
Inflation adjustment uses BLS CPI-U annual data, deflated to 2026 dollars. Nominal stock data from Yahoo Finance (split-adjusted closing prices). Real values are expressed in constant 2010 purchasing-power dollars. For informational and educational purposes only. Not financial advice. Past performance does not guarantee future results. See our methodology and full disclaimer.