What if you invested $1,000 in Comcast in 2010? (Inflation-Adjusted)
CMCSA · Consumer · Adjusted to 2026 dollars using BLS CPI-U data
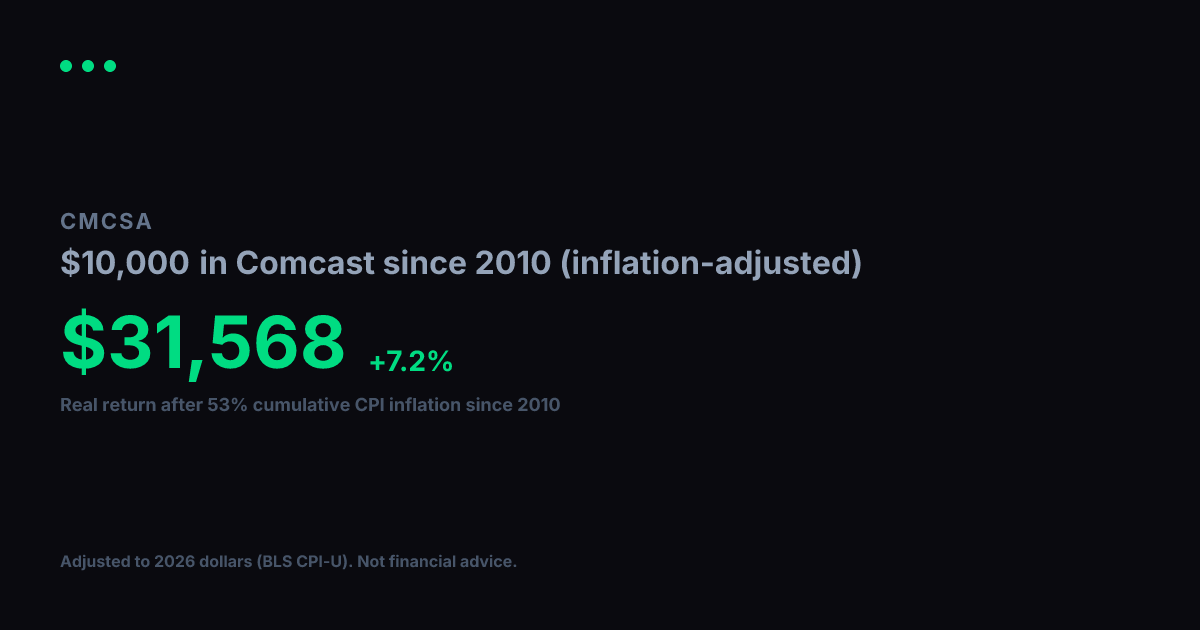
View nominal (non-adjusted) versionComcast turned $1,000 into $4,799 between 2010 and today. Impressive on paper, but inflation over that span came to 53% (BLS CPI-U). Adjusted for that erosion in purchasing power, your real gain in constant 2010 dollars is $3,136, which works out to a +7.1% annualized real growth rate over 17 years.
Nominal final value
$4,799
+379.9% total return
Real value (2010 dollars)
$3,136
+213.6% real total return
Real annualized return
+7.1%
vs. +9.9% nominal annualized
Year-by-Year (Inflation-Adjusted)
$1,000 in Comcast since 2010, values in constant 2010 dollars
| Year | Nominal Value | Real Value (2010 $) |
|---|---|---|
| 2010 | $1,000 | $1,000 |
| 2011 | $1,468 | $1,411 |
| 2012 | $1,756 | $1,653 |
| 2013 | $2,566 | $2,365 |
| 2014 | $3,734 | $3,392 |
| 2015 | $3,692 | $3,354 |
| 2016 | $3,935 | $3,524 |
| 2017 | $5,442 | $4,766 |
| 2018 | $6,214 | $5,280 |
| 2019 | $5,486 | $4,554 |
| 2020 | $6,576 | $5,372 |
| 2021 | $7,716 | $6,002 |
| 2022 | $7,922 | $5,644 |
| 2023 | $6,401 | $4,393 |
| 2024 | $7,793 | $5,195 |
| 2025 | $5,805 | $3,794 |
| 2026 | $5,682 | $3,714 |
Inflation adjustment uses BLS CPI-U annual data, deflated to 2026 dollars. Nominal stock data from Yahoo Finance (split-adjusted closing prices). Real values are expressed in constant 2010 purchasing-power dollars. For informational and educational purposes only. Not financial advice. Past performance does not guarantee future results. See our methodology and full disclaimer.