What if you invested $1,000 in Costco in 2000? (Inflation-Adjusted)
COST · Consumer · Adjusted to 2026 dollars using BLS CPI-U data
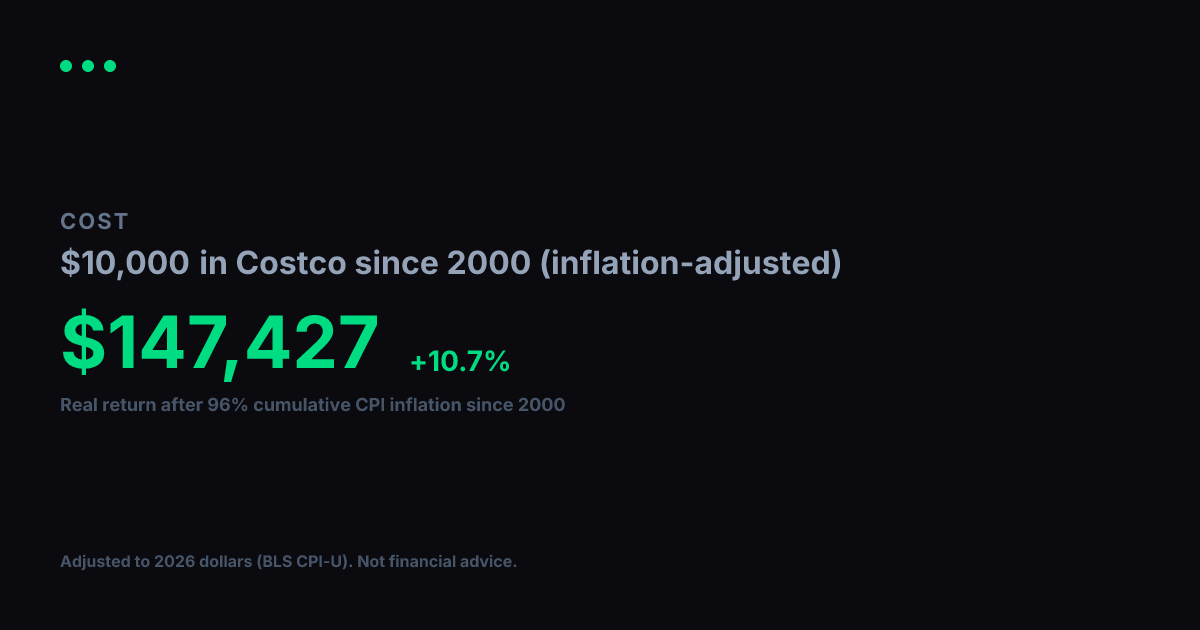
View nominal (non-adjusted) versionA $1,000 investment in Costco in 2000 grew to $28,693 in nominal terms. But 2000 dollars had 96% more purchasing power than today. After adjusting for cumulative inflation using BLS CPI-U data, the real value of that growth works out to $14,640 in constant 2000 dollars, equivalent to a +10.6% real annualized return.
Nominal final value
$28,693
+2769.3% total return
Real value (2000 dollars)
$14,640
+1364.0% real total return
Real annualized return
+10.6%
vs. +13.5% nominal annualized
Year-by-Year (Inflation-Adjusted)
$1,000 in Costco since 2000, values in constant 2000 dollars
| Year | Nominal Value | Real Value (2000 $) |
|---|---|---|
| 2000 | $1,000 | $1,000 |
| 2001 | $945 | $921 |
| 2002 | $940 | $897 |
| 2003 | $590 | $551 |
| 2004 | $755 | $686 |
| 2005 | $973 | $854 |
| 2006 | $1,037 | $883 |
| 2007 | $1,179 | $974 |
| 2008 | $1,440 | $1,146 |
| 2009 | $964 | $772 |
| 2010 | $1,247 | $973 |
| 2011 | $1,580 | $1,185 |
| 2012 | $1,831 | $1,345 |
| 2013 | $2,468 | $1,776 |
| 2014 | $2,739 | $1,942 |
| 2015 | $3,525 | $2,500 |
| 2016 | $3,889 | $2,719 |
| 2017 | $4,268 | $2,918 |
| 2018 | $5,340 | $3,542 |
| 2019 | $5,944 | $3,851 |
| 2020 | $8,544 | $5,449 |
| 2021 | $10,199 | $6,192 |
| 2022 | $14,730 | $8,192 |
| 2023 | $15,005 | $8,038 |
| 2024 | $21,021 | $10,939 |
| 2025 | $29,816 | $15,212 |
| 2026 | $28,759 | $14,673 |
Inflation adjustment uses BLS CPI-U annual data, deflated to 2026 dollars. Nominal stock data from Yahoo Finance (split-adjusted closing prices). Real values are expressed in constant 2000 purchasing-power dollars. For informational and educational purposes only. Not financial advice. Past performance does not guarantee future results. See our methodology and full disclaimer.