What if you invested $1,000 in Dow Jones (DIA) in 2000? (Inflation-Adjusted)
DIA · Index · Adjusted to 2026 dollars using BLS CPI-U data
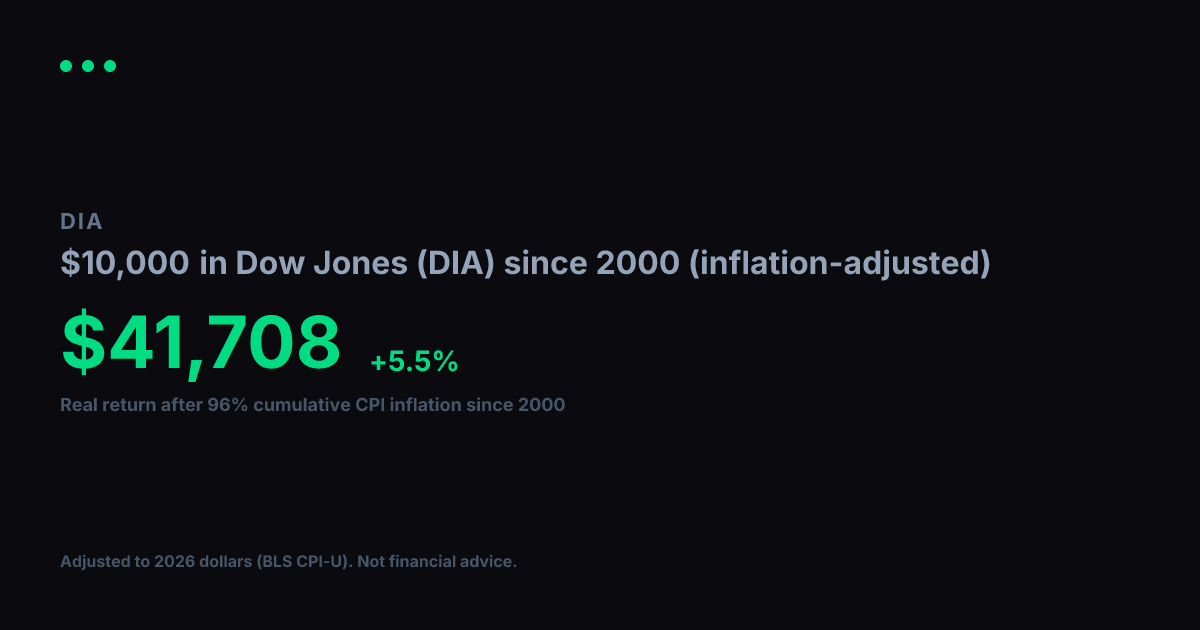
View nominal (non-adjusted) versionA $1,000 investment in Dow Jones (DIA) in 2000 grew to $8,376 in nominal terms. But 2000 dollars had 96% more purchasing power than today. After adjusting for cumulative inflation using BLS CPI-U data, the real value of that growth works out to $4,274 in constant 2000 dollars, equivalent to a +5.6% real annualized return.
Nominal final value
$8,376
+737.6% total return
Real value (2000 dollars)
$4,274
+327.4% real total return
Real annualized return
+5.6%
vs. +8.3% nominal annualized
Year-by-Year (Inflation-Adjusted)
$1,000 in Dow Jones (DIA) since 2000, values in constant 2000 dollars
| Year | Nominal Value | Real Value (2000 $) |
|---|---|---|
| 2000 | $1,000 | $1,000 |
| 2001 | $1,006 | $980 |
| 2002 | $934 | $891 |
| 2003 | $776 | $724 |
| 2004 | $1,030 | $935 |
| 2005 | $1,049 | $921 |
| 2006 | $1,107 | $943 |
| 2007 | $1,319 | $1,091 |
| 2008 | $1,345 | $1,070 |
| 2009 | $878 | $704 |
| 2010 | $1,139 | $889 |
| 2011 | $1,378 | $1,034 |
| 2012 | $1,502 | $1,104 |
| 2013 | $1,692 | $1,217 |
| 2014 | $1,960 | $1,390 |
| 2015 | $2,188 | $1,552 |
| 2016 | $2,147 | $1,501 |
| 2017 | $2,656 | $1,816 |
| 2018 | $3,580 | $2,374 |
| 2019 | $3,497 | $2,266 |
| 2020 | $4,038 | $2,575 |
| 2021 | $4,380 | $2,659 |
| 2022 | $5,216 | $2,901 |
| 2023 | $5,163 | $2,766 |
| 2024 | $5,892 | $3,066 |
| 2025 | $6,999 | $3,571 |
| 2026 | $7,804 | $3,982 |
Inflation adjustment uses BLS CPI-U annual data, deflated to 2026 dollars. Nominal stock data from Yahoo Finance (split-adjusted closing prices). Real values are expressed in constant 2000 purchasing-power dollars. For informational and educational purposes only. Not financial advice. Past performance does not guarantee future results. See our methodology and full disclaimer.