What if you invested $1,000 in Eli Lilly in 2010? (Inflation-Adjusted)
LLY · Healthcare · Adjusted to 2026 dollars using BLS CPI-U data
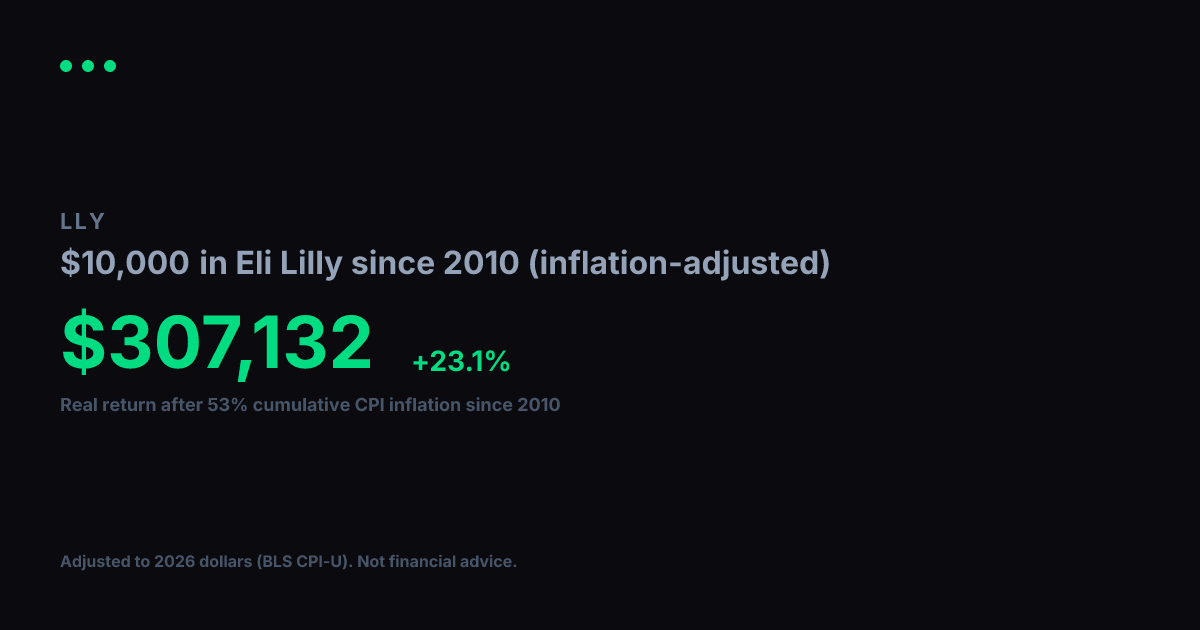
View nominal (non-adjusted) versionEli Lilly turned $1,000 into $52,141 between 2010 and today. Impressive on paper, but inflation over that span came to 53% (BLS CPI-U). Adjusted for that erosion in purchasing power, your real gain in constant 2010 dollars is $34,079, which works out to a +23.7% annualized real growth rate over 17 years.
Nominal final value
$52,141
+5114.1% total return
Real value (2010 dollars)
$34,079
+3307.9% real total return
Real annualized return
+23.7%
vs. +26.9% nominal annualized
Year-by-Year (Inflation-Adjusted)
$1,000 in Eli Lilly since 2010, values in constant 2010 dollars
| Year | Nominal Value | Real Value (2010 $) |
|---|---|---|
| 2010 | $1,000 | $1,000 |
| 2011 | $1,043 | $1,003 |
| 2012 | $1,259 | $1,185 |
| 2013 | $1,780 | $1,641 |
| 2014 | $1,858 | $1,688 |
| 2015 | $2,559 | $2,325 |
| 2016 | $2,886 | $2,585 |
| 2017 | $2,886 | $2,528 |
| 2018 | $3,132 | $2,661 |
| 2019 | $4,724 | $3,922 |
| 2020 | $5,628 | $4,598 |
| 2021 | $8,551 | $6,650 |
| 2022 | $10,242 | $7,297 |
| 2023 | $14,560 | $9,992 |
| 2024 | $27,584 | $18,389 |
| 2025 | $34,880 | $22,797 |
| 2026 | $44,934 | $29,369 |
Inflation adjustment uses BLS CPI-U annual data, deflated to 2026 dollars. Nominal stock data from Yahoo Finance (split-adjusted closing prices). Real values are expressed in constant 2010 purchasing-power dollars. For informational and educational purposes only. Not financial advice. Past performance does not guarantee future results. See our methodology and full disclaimer.