What if you invested $1,000 in Emerging Markets (EEM) in 2005? (Inflation-Adjusted)
EEM · Index · Adjusted to 2026 dollars using BLS CPI-U data
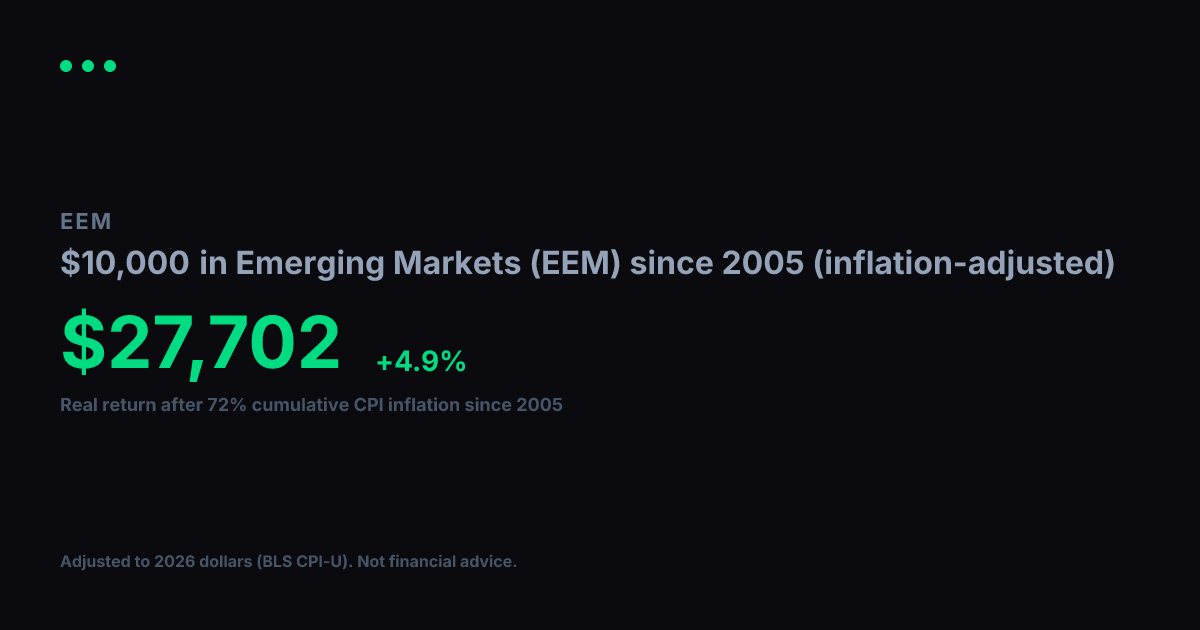
View nominal (non-adjusted) versionUsing BLS CPI-U data, cumulative inflation from 2005 to 2026 totals 72%. Your $1,000 in Emerging Markets (EEM) grew to $4,674 in raw dollar terms, but in real purchasing power terms that gain is equivalent to $2,717 in constant 2005 dollars. That reflects a +4.7% per year real annualized return after accounting for price changes over 22 years.
Nominal final value
$4,674
+367.4% total return
Real value (2005 dollars)
$2,717
+171.7% real total return
Real annualized return
+4.7%
vs. +7.4% nominal annualized
Year-by-Year (Inflation-Adjusted)
$1,000 in Emerging Markets (EEM) since 2005, values in constant 2005 dollars
| Year | Nominal Value | Real Value (2005 $) |
|---|---|---|
| 2005 | $1,000 | $1,000 |
| 2006 | $1,523 | $1,478 |
| 2007 | $1,751 | $1,650 |
| 2008 | $2,125 | $1,927 |
| 2009 | $1,082 | $987 |
| 2010 | $1,858 | $1,653 |
| 2011 | $2,257 | $1,929 |
| 2012 | $2,116 | $1,772 |
| 2013 | $2,263 | $1,855 |
| 2014 | $1,998 | $1,615 |
| 2015 | $2,087 | $1,687 |
| 2016 | $1,673 | $1,333 |
| 2017 | $2,083 | $1,623 |
| 2018 | $2,903 | $2,194 |
| 2019 | $2,505 | $1,850 |
| 2020 | $2,519 | $1,831 |
| 2021 | $3,241 | $2,242 |
| 2022 | $3,026 | $1,918 |
| 2023 | $2,624 | $1,602 |
| 2024 | $2,501 | $1,483 |
| 2025 | $2,850 | $1,657 |
| 2026 | $4,038 | $2,347 |
Inflation adjustment uses BLS CPI-U annual data, deflated to 2026 dollars. Nominal stock data from Yahoo Finance (split-adjusted closing prices). Real values are expressed in constant 2005 purchasing-power dollars. For informational and educational purposes only. Not financial advice. Past performance does not guarantee future results. See our methodology and full disclaimer.