What if you invested $1,000 in Enphase Energy in 2012? (Inflation-Adjusted)
ENPH · Energy · Adjusted to 2026 dollars using BLS CPI-U data
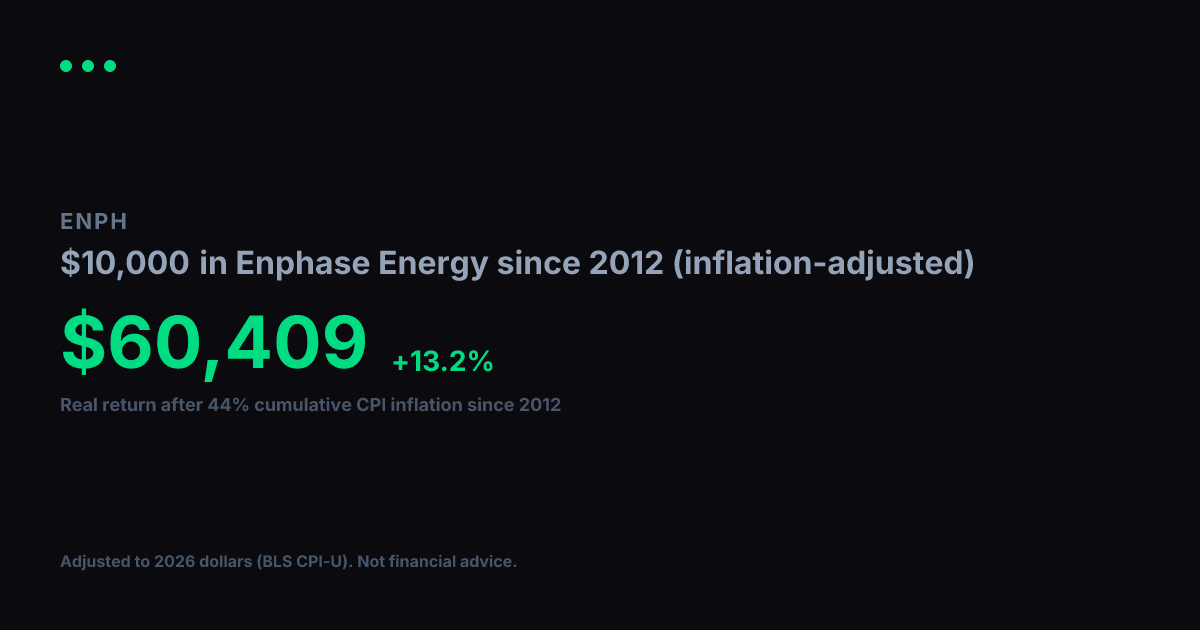
View nominal (non-adjusted) versionA $1,000 investment in Enphase Energy in 2012 grew to $6,708 in nominal terms. But 2012 dollars had 44% more purchasing power than today. After adjusting for cumulative inflation using BLS CPI-U data, the real value of that growth works out to $4,659 in constant 2012 dollars, equivalent to a +11.1% real annualized return.
Nominal final value
$6,708
+570.8% total return
Real value (2012 dollars)
$4,659
+365.9% real total return
Real annualized return
+11.1%
vs. +13.9% nominal annualized
Year-by-Year (Inflation-Adjusted)
$1,000 in Enphase Energy since 2012, values in constant 2012 dollars
| Year | Nominal Value | Real Value (2012 $) |
|---|---|---|
| 2012 | $1,000 | $1,000 |
| 2013 | $514 | $503 |
| 2014 | $1,008 | $973 |
| 2015 | $1,688 | $1,629 |
| 2016 | $331 | $315 |
| 2017 | $203 | $189 |
| 2018 | $300 | $271 |
| 2019 | $985 | $869 |
| 2020 | $4,294 | $3,728 |
| 2021 | $24,843 | $20,530 |
| 2022 | $19,138 | $14,486 |
| 2023 | $30,161 | $21,992 |
| 2024 | $14,187 | $10,049 |
| 2025 | $8,485 | $5,892 |
| 2026 | $5,038 | $3,499 |
Inflation adjustment uses BLS CPI-U annual data, deflated to 2026 dollars. Nominal stock data from Yahoo Finance (split-adjusted closing prices). Real values are expressed in constant 2012 purchasing-power dollars. For informational and educational purposes only. Not financial advice. Past performance does not guarantee future results. See our methodology and full disclaimer.