What if you invested $1,000 in ExxonMobil in 2000? (Inflation-Adjusted)
XOM · Energy · Adjusted to 2026 dollars using BLS CPI-U data
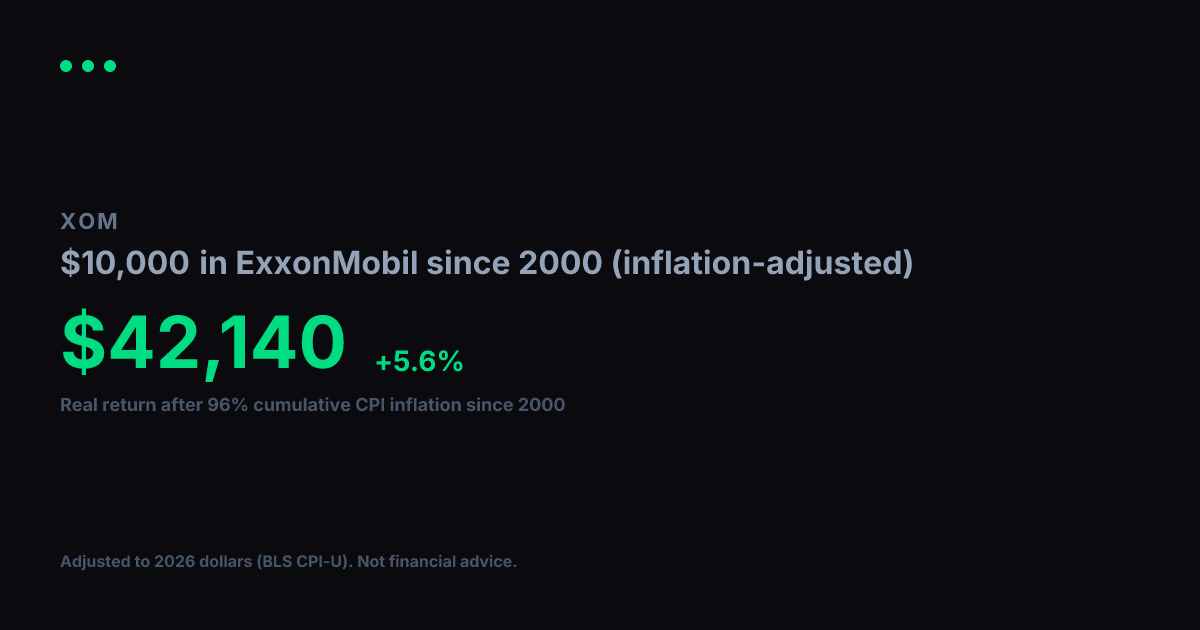
View nominal (non-adjusted) versionA $1,000 investment in ExxonMobil in 2000 grew to $7,588 in nominal terms. But 2000 dollars had 96% more purchasing power than today. After adjusting for cumulative inflation using BLS CPI-U data, the real value of that growth works out to $3,871 in constant 2000 dollars, equivalent to a +5.2% real annualized return.
Nominal final value
$7,588
+658.8% total return
Real value (2000 dollars)
$3,871
+287.1% real total return
Real annualized return
+5.2%
vs. +7.9% nominal annualized
Year-by-Year (Inflation-Adjusted)
$1,000 in ExxonMobil since 2000, values in constant 2000 dollars
| Year | Nominal Value | Real Value (2000 $) |
|---|---|---|
| 2000 | $1,000 | $1,000 |
| 2001 | $1,037 | $1,011 |
| 2002 | $984 | $939 |
| 2003 | $882 | $823 |
| 2004 | $1,083 | $984 |
| 2005 | $1,403 | $1,231 |
| 2006 | $1,741 | $1,483 |
| 2007 | $2,096 | $1,732 |
| 2008 | $2,464 | $1,961 |
| 2009 | $2,243 | $1,796 |
| 2010 | $1,933 | $1,509 |
| 2011 | $2,486 | $1,864 |
| 2012 | $2,641 | $1,941 |
| 2013 | $2,910 | $2,093 |
| 2014 | $3,062 | $2,171 |
| 2015 | $2,987 | $2,118 |
| 2016 | $2,751 | $1,923 |
| 2017 | $3,069 | $2,098 |
| 2018 | $3,316 | $2,199 |
| 2019 | $2,898 | $1,878 |
| 2020 | $2,575 | $1,642 |
| 2021 | $2,007 | $1,218 |
| 2022 | $3,609 | $2,007 |
| 2023 | $5,730 | $3,070 |
| 2024 | $5,252 | $2,733 |
| 2025 | $5,643 | $2,879 |
| 2026 | $7,743 | $3,951 |
Inflation adjustment uses BLS CPI-U annual data, deflated to 2026 dollars. Nominal stock data from Yahoo Finance (split-adjusted closing prices). Real values are expressed in constant 2000 purchasing-power dollars. For informational and educational purposes only. Not financial advice. Past performance does not guarantee future results. See our methodology and full disclaimer.