What if you invested $1,000 in ExxonMobil in 2010? (Inflation-Adjusted)
XOM · Energy · Adjusted to 2026 dollars using BLS CPI-U data
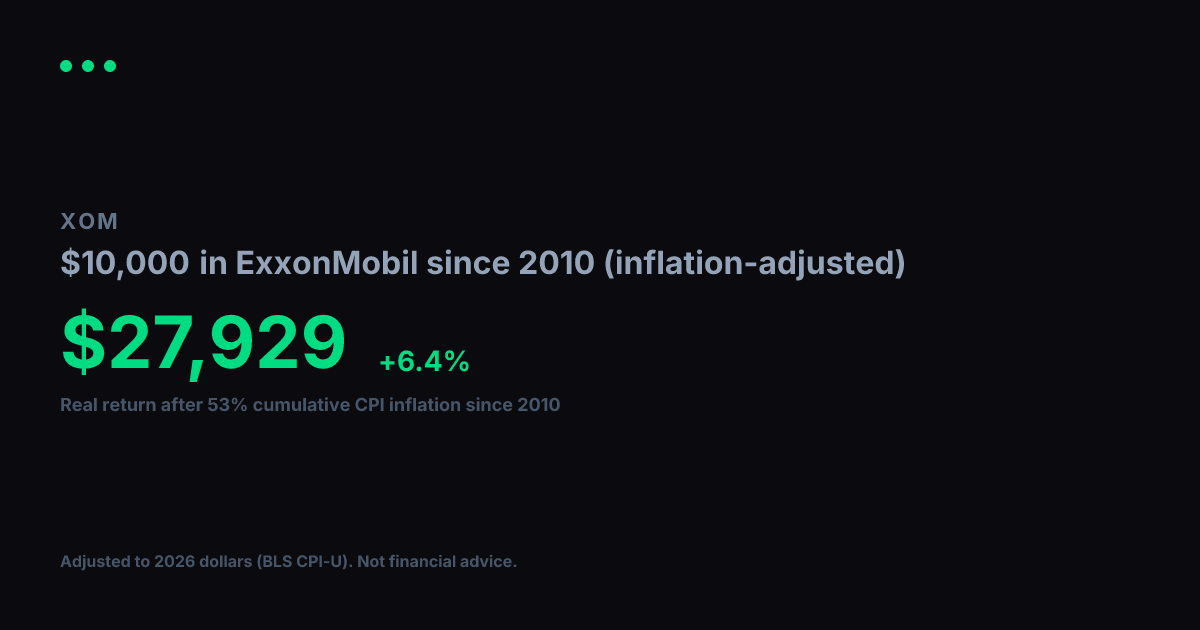
View nominal (non-adjusted) versionExxonMobil turned $1,000 into $3,926 between 2010 and today. Impressive on paper, but inflation over that span came to 53% (BLS CPI-U). Adjusted for that erosion in purchasing power, your real gain in constant 2010 dollars is $2,566, which works out to a +5.8% annualized real growth rate over 17 years.
Nominal final value
$3,926
+292.6% total return
Real value (2010 dollars)
$2,566
+156.6% real total return
Real annualized return
+5.8%
vs. +8.6% nominal annualized
Year-by-Year (Inflation-Adjusted)
$1,000 in ExxonMobil since 2010, values in constant 2010 dollars
| Year | Nominal Value | Real Value (2010 $) |
|---|---|---|
| 2010 | $1,000 | $1,000 |
| 2011 | $1,286 | $1,236 |
| 2012 | $1,367 | $1,286 |
| 2013 | $1,505 | $1,387 |
| 2014 | $1,584 | $1,439 |
| 2015 | $1,545 | $1,404 |
| 2016 | $1,423 | $1,274 |
| 2017 | $1,588 | $1,391 |
| 2018 | $1,715 | $1,457 |
| 2019 | $1,500 | $1,245 |
| 2020 | $1,332 | $1,088 |
| 2021 | $1,038 | $808 |
| 2022 | $1,867 | $1,330 |
| 2023 | $2,965 | $2,035 |
| 2024 | $2,717 | $1,811 |
| 2025 | $2,920 | $1,908 |
| 2026 | $4,006 | $2,618 |
Inflation adjustment uses BLS CPI-U annual data, deflated to 2026 dollars. Nominal stock data from Yahoo Finance (split-adjusted closing prices). Real values are expressed in constant 2010 purchasing-power dollars. For informational and educational purposes only. Not financial advice. Past performance does not guarantee future results. See our methodology and full disclaimer.