What if you invested $1,000 in Ford in 2010? (Inflation-Adjusted)
F · Industrial · Adjusted to 2026 dollars using BLS CPI-U data
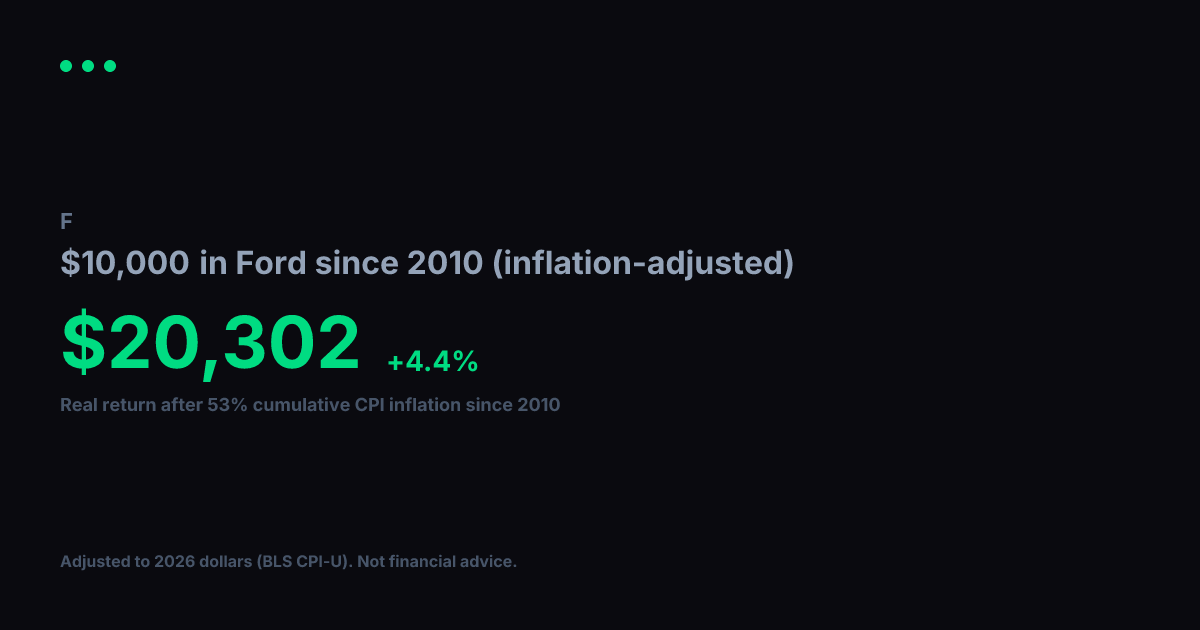
View nominal (non-adjusted) versionFord turned $1,000 into $2,552 between 2010 and today. Impressive on paper, but inflation over that span came to 53% (BLS CPI-U). Adjusted for that erosion in purchasing power, your real gain in constant 2010 dollars is $1,668, which works out to a +3.1% annualized real growth rate over 17 years.
Nominal final value
$2,552
+155.2% total return
Real value (2010 dollars)
$1,668
+66.8% real total return
Real annualized return
+3.1%
vs. +5.8% nominal annualized
Year-by-Year (Inflation-Adjusted)
$1,000 in Ford since 2010, values in constant 2010 dollars
| Year | Nominal Value | Real Value (2010 $) |
|---|---|---|
| 2010 | $1,000 | $1,000 |
| 2011 | $1,471 | $1,414 |
| 2012 | $1,150 | $1,083 |
| 2013 | $1,226 | $1,130 |
| 2014 | $1,455 | $1,322 |
| 2015 | $1,480 | $1,344 |
| 2016 | $1,279 | $1,145 |
| 2017 | $1,392 | $1,219 |
| 2018 | $1,316 | $1,118 |
| 2019 | $1,123 | $933 |
| 2020 | $1,200 | $981 |
| 2021 | $1,433 | $1,115 |
| 2022 | $2,791 | $1,988 |
| 2023 | $1,908 | $1,309 |
| 2024 | $1,829 | $1,219 |
| 2025 | $1,683 | $1,100 |
| 2026 | $2,490 | $1,627 |
Inflation adjustment uses BLS CPI-U annual data, deflated to 2026 dollars. Nominal stock data from Yahoo Finance (split-adjusted closing prices). Real values are expressed in constant 2010 purchasing-power dollars. For informational and educational purposes only. Not financial advice. Past performance does not guarantee future results. See our methodology and full disclaimer.