What if you invested $1,000 in General Mills in 2000? (Inflation-Adjusted)
GIS · Consumer · Adjusted to 2026 dollars using BLS CPI-U data
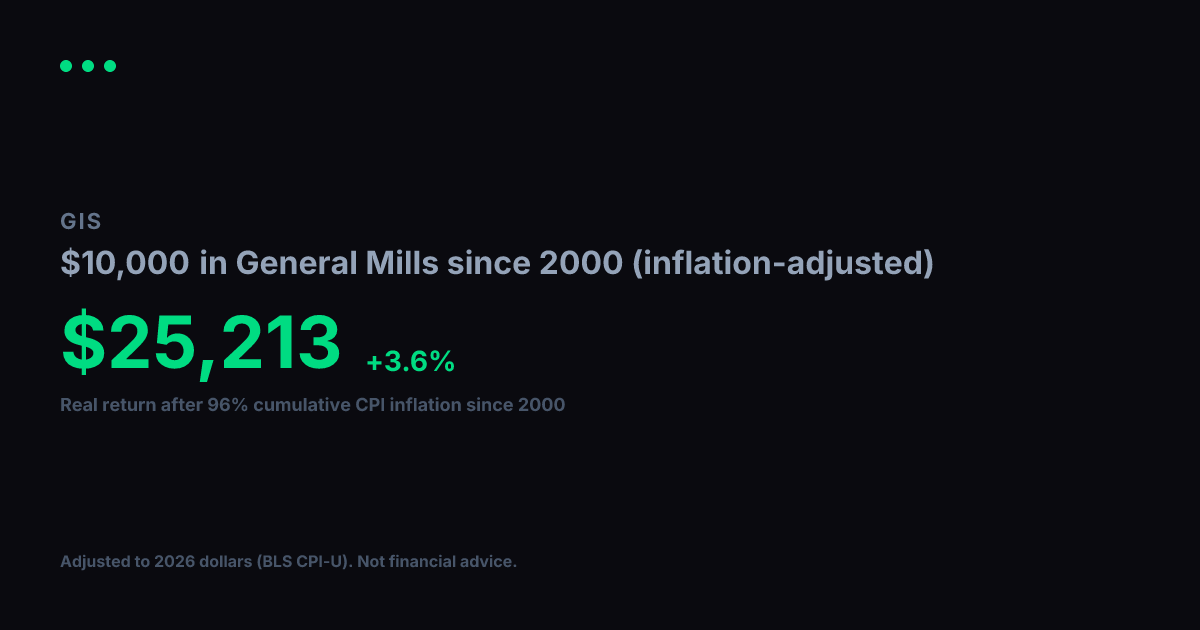
View nominal (non-adjusted) versionA $1,000 investment in General Mills in 2000 grew to $5,108 in nominal terms. But 2000 dollars had 96% more purchasing power than today. After adjusting for cumulative inflation using BLS CPI-U data, the real value of that growth works out to $2,606 in constant 2000 dollars, equivalent to a +3.7% real annualized return.
Nominal final value
$5,108
+410.8% total return
Real value (2000 dollars)
$2,606
+160.6% real total return
Real annualized return
+3.7%
vs. +6.3% nominal annualized
Year-by-Year (Inflation-Adjusted)
$1,000 in General Mills since 2000, values in constant 2000 dollars
| Year | Nominal Value | Real Value (2000 $) |
|---|---|---|
| 2000 | $1,000 | $1,000 |
| 2001 | $1,385 | $1,350 |
| 2002 | $1,681 | $1,604 |
| 2003 | $1,561 | $1,457 |
| 2004 | $1,616 | $1,467 |
| 2005 | $1,933 | $1,697 |
| 2006 | $1,809 | $1,542 |
| 2007 | $2,188 | $1,808 |
| 2008 | $2,139 | $1,703 |
| 2009 | $2,385 | $1,910 |
| 2010 | $2,965 | $2,315 |
| 2011 | $2,978 | $2,234 |
| 2012 | $3,520 | $2,586 |
| 2013 | $3,827 | $2,753 |
| 2014 | $4,518 | $3,204 |
| 2015 | $5,095 | $3,613 |
| 2016 | $5,660 | $3,956 |
| 2017 | $6,444 | $4,406 |
| 2018 | $6,244 | $4,141 |
| 2019 | $4,943 | $3,203 |
| 2020 | $6,044 | $3,855 |
| 2021 | $6,958 | $4,225 |
| 2022 | $8,508 | $4,731 |
| 2023 | $9,991 | $5,352 |
| 2024 | $8,527 | $4,437 |
| 2025 | $8,186 | $4,177 |
| 2026 | $6,585 | $3,360 |
Inflation adjustment uses BLS CPI-U annual data, deflated to 2026 dollars. Nominal stock data from Yahoo Finance (split-adjusted closing prices). Real values are expressed in constant 2000 purchasing-power dollars. For informational and educational purposes only. Not financial advice. Past performance does not guarantee future results. See our methodology and full disclaimer.