What if you invested $1,000 in General Mills in 2010? (Inflation-Adjusted)
GIS · Consumer · Adjusted to 2026 dollars using BLS CPI-U data
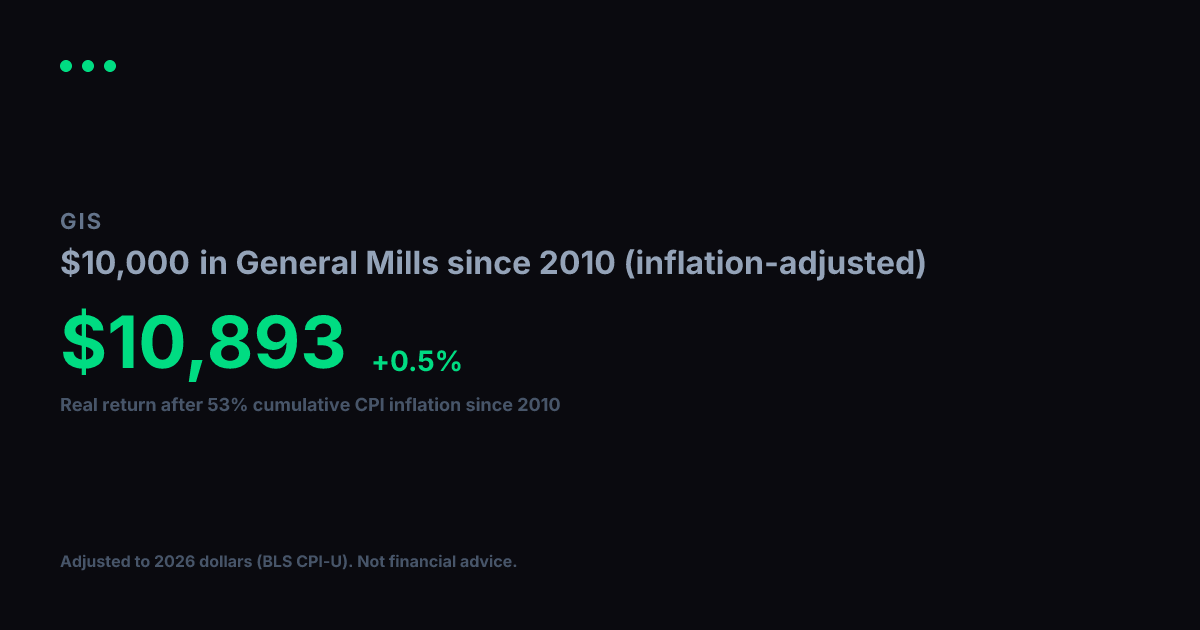
View nominal (non-adjusted) versionGeneral Mills turned $1,000 into $1,723 between 2010 and today. Impressive on paper, but inflation over that span came to 53% (BLS CPI-U). Adjusted for that erosion in purchasing power, your real gain in constant 2010 dollars is $1,126, which works out to a +0.7% annualized real growth rate over 17 years.
Nominal final value
$1,723
+72.3% total return
Real value (2010 dollars)
$1,126
+12.6% real total return
Real annualized return
+0.7%
vs. +3.3% nominal annualized
Year-by-Year (Inflation-Adjusted)
$1,000 in General Mills since 2010, values in constant 2010 dollars
| Year | Nominal Value | Real Value (2010 $) |
|---|---|---|
| 2010 | $1,000 | $1,000 |
| 2011 | $1,004 | $965 |
| 2012 | $1,187 | $1,117 |
| 2013 | $1,291 | $1,189 |
| 2014 | $1,524 | $1,384 |
| 2015 | $1,718 | $1,561 |
| 2016 | $1,909 | $1,709 |
| 2017 | $2,173 | $1,903 |
| 2018 | $2,106 | $1,789 |
| 2019 | $1,667 | $1,384 |
| 2020 | $2,038 | $1,665 |
| 2021 | $2,347 | $1,825 |
| 2022 | $2,869 | $2,044 |
| 2023 | $3,370 | $2,312 |
| 2024 | $2,876 | $1,917 |
| 2025 | $2,761 | $1,804 |
| 2026 | $2,221 | $1,451 |
Inflation adjustment uses BLS CPI-U annual data, deflated to 2026 dollars. Nominal stock data from Yahoo Finance (split-adjusted closing prices). Real values are expressed in constant 2010 purchasing-power dollars. For informational and educational purposes only. Not financial advice. Past performance does not guarantee future results. See our methodology and full disclaimer.