What if you invested $1,000 in Honeywell in 2010? (Inflation-Adjusted)
HON · Industrial · Adjusted to 2026 dollars using BLS CPI-U data
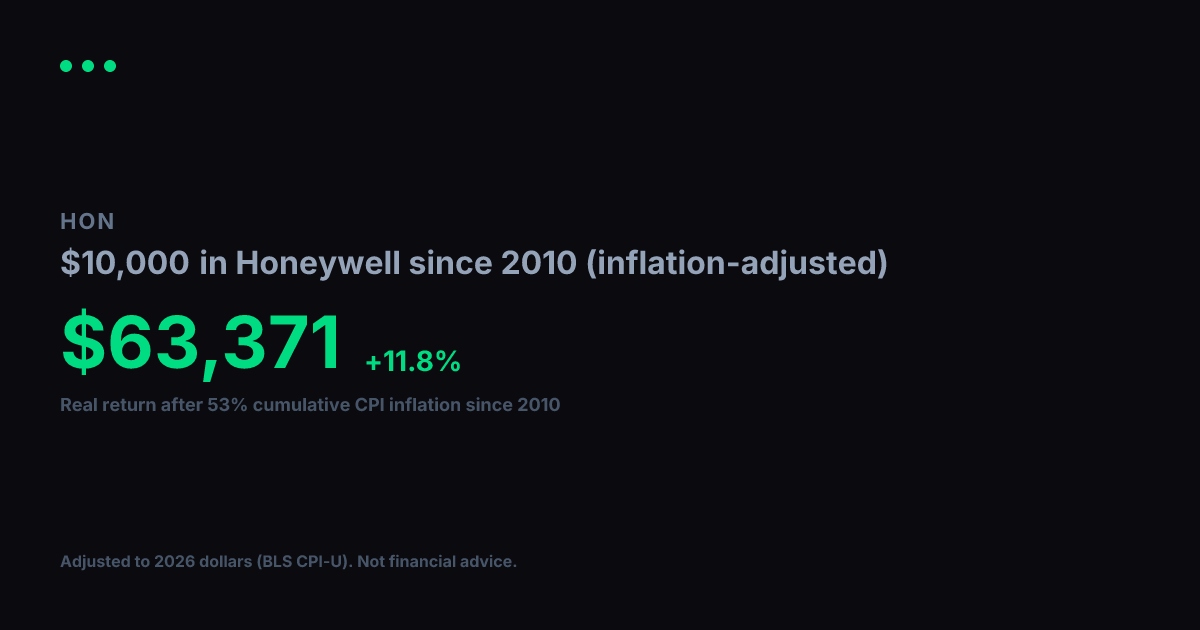
View nominal (non-adjusted) versionHoneywell turned $1,000 into $8,964 between 2010 and today. Impressive on paper, but inflation over that span came to 53% (BLS CPI-U). Adjusted for that erosion in purchasing power, your real gain in constant 2010 dollars is $5,859, which works out to a +11.2% annualized real growth rate over 17 years.
Nominal final value
$8,964
+796.4% total return
Real value (2010 dollars)
$5,859
+485.9% real total return
Real annualized return
+11.2%
vs. +14.1% nominal annualized
Year-by-Year (Inflation-Adjusted)
$1,000 in Honeywell since 2010, values in constant 2010 dollars
| Year | Nominal Value | Real Value (2010 $) |
|---|---|---|
| 2010 | $1,000 | $1,000 |
| 2011 | $1,493 | $1,434 |
| 2012 | $1,589 | $1,495 |
| 2013 | $1,920 | $1,769 |
| 2014 | $2,624 | $2,384 |
| 2015 | $2,871 | $2,608 |
| 2016 | $3,097 | $2,773 |
| 2017 | $3,652 | $3,199 |
| 2018 | $5,035 | $4,278 |
| 2019 | $4,828 | $4,007 |
| 2020 | $5,947 | $4,858 |
| 2021 | $6,871 | $5,344 |
| 2022 | $7,321 | $5,215 |
| 2023 | $7,626 | $5,233 |
| 2024 | $7,570 | $5,047 |
| 2025 | $8,561 | $5,595 |
| 2026 | $9,449 | $6,176 |
Inflation adjustment uses BLS CPI-U annual data, deflated to 2026 dollars. Nominal stock data from Yahoo Finance (split-adjusted closing prices). Real values are expressed in constant 2010 purchasing-power dollars. For informational and educational purposes only. Not financial advice. Past performance does not guarantee future results. See our methodology and full disclaimer.