What if you invested $1,000 in Intel in 2000? (Inflation-Adjusted)
INTC · Technology · Adjusted to 2026 dollars using BLS CPI-U data
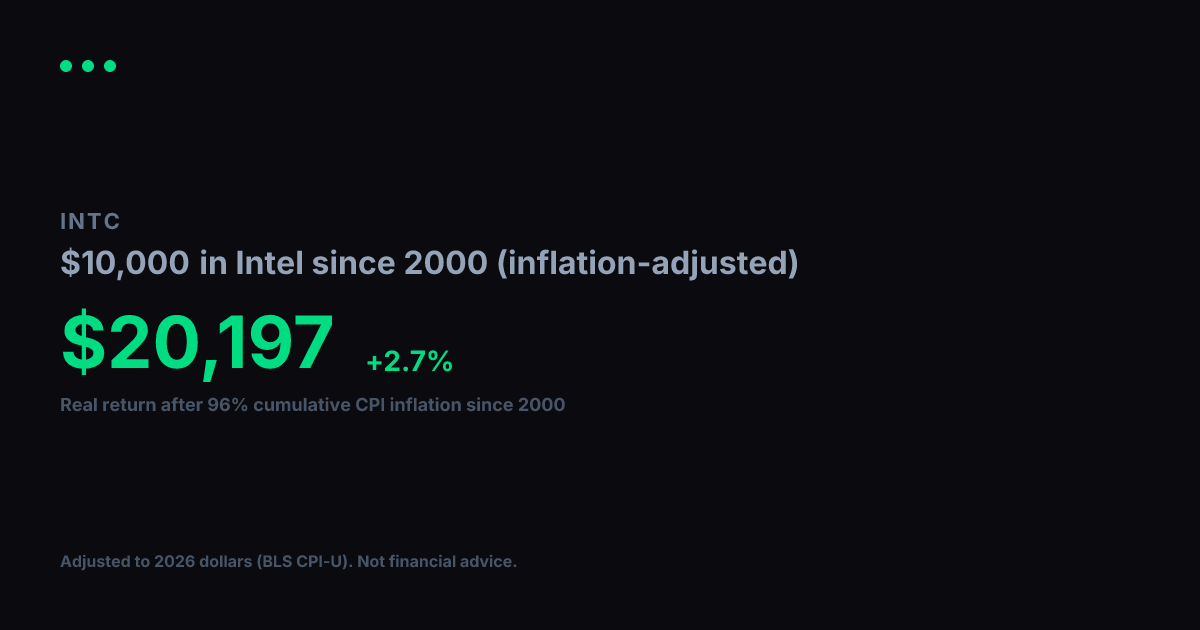
View nominal (non-adjusted) versionA $1,000 investment in Intel in 2000 grew to $4,969 in nominal terms. But 2000 dollars had 96% more purchasing power than today. After adjusting for cumulative inflation using BLS CPI-U data, the real value of that growth works out to $2,535 in constant 2000 dollars, equivalent to a +3.6% real annualized return.
Nominal final value
$4,969
+396.9% total return
Real value (2000 dollars)
$2,535
+153.5% real total return
Real annualized return
+3.6%
vs. +6.2% nominal annualized
Year-by-Year (Inflation-Adjusted)
$1,000 in Intel since 2000, values in constant 2000 dollars
| Year | Nominal Value | Real Value (2000 $) |
|---|---|---|
| 2000 | $1,000 | $1,000 |
| 2001 | $749 | $730 |
| 2002 | $711 | $678 |
| 2003 | $319 | $298 |
| 2004 | $624 | $567 |
| 2005 | $462 | $405 |
| 2006 | $443 | $378 |
| 2007 | $446 | $369 |
| 2008 | $458 | $364 |
| 2009 | $287 | $230 |
| 2010 | $447 | $349 |
| 2011 | $510 | $382 |
| 2012 | $650 | $477 |
| 2013 | $535 | $385 |
| 2014 | $649 | $461 |
| 2015 | $902 | $640 |
| 2016 | $872 | $610 |
| 2017 | $1,070 | $731 |
| 2018 | $1,438 | $954 |
| 2019 | $1,443 | $935 |
| 2020 | $2,007 | $1,280 |
| 2021 | $1,786 | $1,084 |
| 2022 | $1,611 | $896 |
| 2023 | $970 | $519 |
| 2024 | $1,513 | $787 |
| 2025 | $691 | $353 |
| 2026 | $1,654 | $844 |
Inflation adjustment uses BLS CPI-U annual data, deflated to 2026 dollars. Nominal stock data from Yahoo Finance (split-adjusted closing prices). Real values are expressed in constant 2000 purchasing-power dollars. For informational and educational purposes only. Not financial advice. Past performance does not guarantee future results. See our methodology and full disclaimer.