What if you invested $1,000 in Intel in 2005? (Inflation-Adjusted)
INTC · Technology · Adjusted to 2026 dollars using BLS CPI-U data
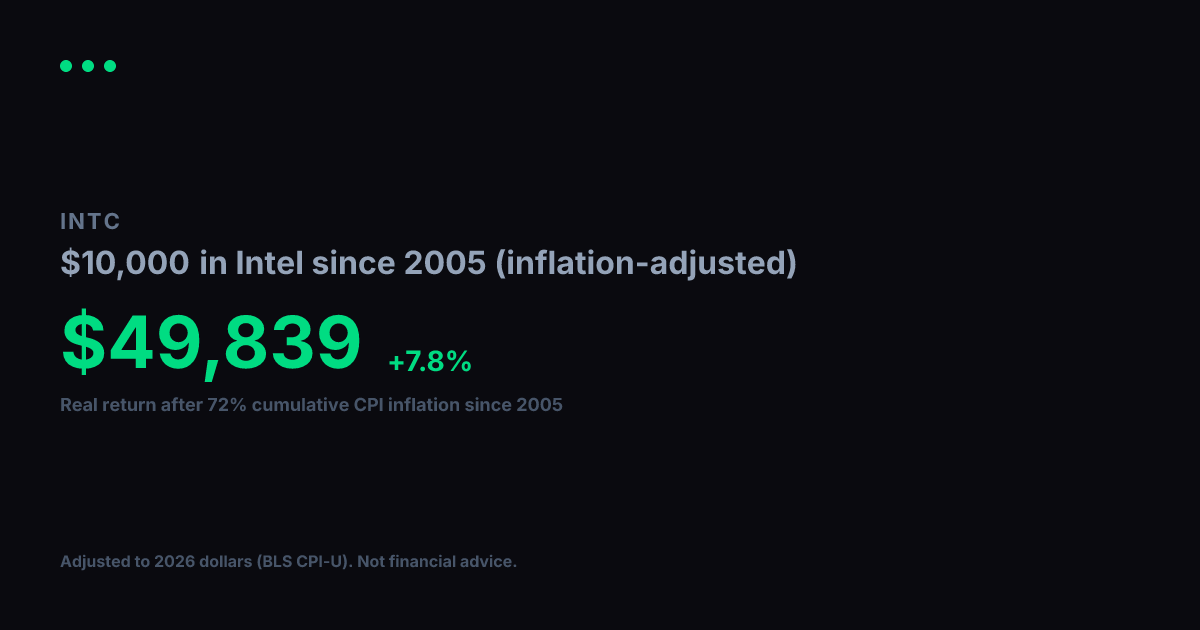
View nominal (non-adjusted) versionUsing BLS CPI-U data, cumulative inflation from 2005 to 2026 totals 72%. Your $1,000 in Intel grew to $10,760 in raw dollar terms, but in real purchasing power terms that gain is equivalent to $6,256 in constant 2005 dollars. That reflects a +8.9% per year real annualized return after accounting for price changes over 22 years.
Nominal final value
$10,760
+976.0% total return
Real value (2005 dollars)
$6,256
+525.6% real total return
Real annualized return
+8.9%
vs. +11.6% nominal annualized
Year-by-Year (Inflation-Adjusted)
$1,000 in Intel since 2005, values in constant 2005 dollars
| Year | Nominal Value | Real Value (2005 $) |
|---|---|---|
| 2005 | $1,000 | $1,000 |
| 2006 | $960 | $932 |
| 2007 | $966 | $909 |
| 2008 | $991 | $899 |
| 2009 | $622 | $568 |
| 2010 | $968 | $861 |
| 2011 | $1,104 | $943 |
| 2012 | $1,407 | $1,178 |
| 2013 | $1,159 | $951 |
| 2014 | $1,406 | $1,137 |
| 2015 | $1,953 | $1,579 |
| 2016 | $1,889 | $1,505 |
| 2017 | $2,316 | $1,805 |
| 2018 | $3,114 | $2,354 |
| 2019 | $3,125 | $2,307 |
| 2020 | $4,346 | $3,158 |
| 2021 | $3,867 | $2,676 |
| 2022 | $3,489 | $2,211 |
| 2023 | $2,100 | $1,282 |
| 2024 | $3,276 | $1,943 |
| 2025 | $1,497 | $871 |
| 2026 | $3,581 | $2,082 |
Inflation adjustment uses BLS CPI-U annual data, deflated to 2026 dollars. Nominal stock data from Yahoo Finance (split-adjusted closing prices). Real values are expressed in constant 2005 purchasing-power dollars. For informational and educational purposes only. Not financial advice. Past performance does not guarantee future results. See our methodology and full disclaimer.