What if you invested $1,000 in Japan (EWJ) in 2000? (Inflation-Adjusted)
EWJ · Index · Adjusted to 2026 dollars using BLS CPI-U data
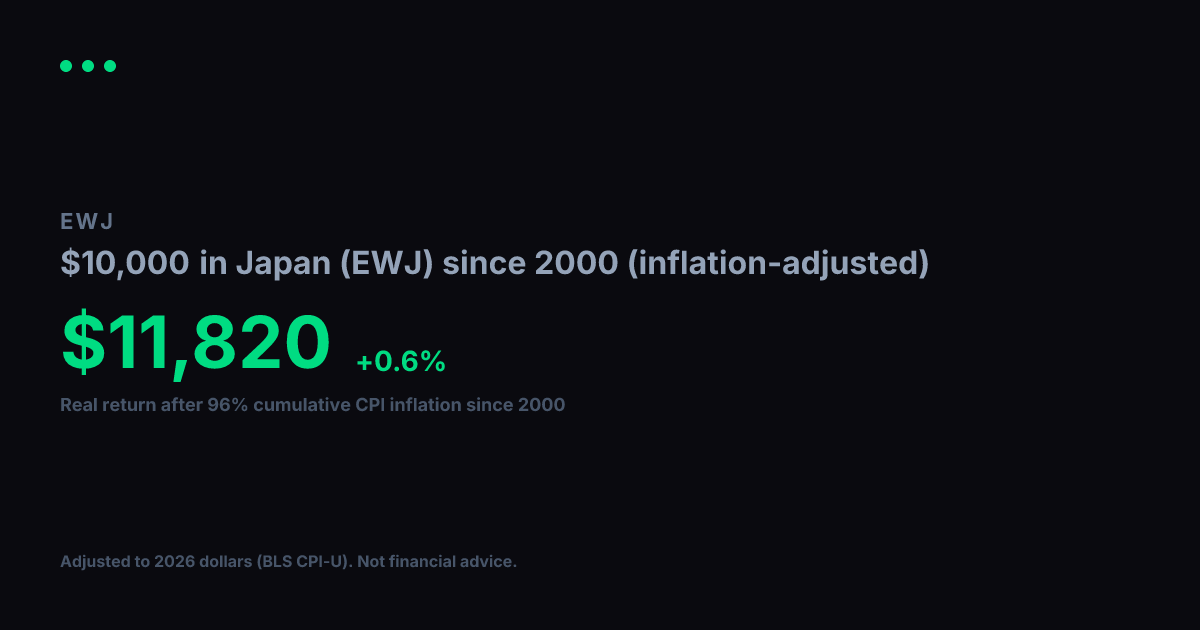
View nominal (non-adjusted) versionA $1,000 investment in Japan (EWJ) in 2000 grew to $2,332 in nominal terms. But 2000 dollars had 96% more purchasing power than today. After adjusting for cumulative inflation using BLS CPI-U data, the real value of that growth works out to $1,190 in constant 2000 dollars, equivalent to a +0.7% real annualized return.
Nominal final value
$2,332
+133.2% total return
Real value (2000 dollars)
$1,190
+19.0% real total return
Real annualized return
+0.7%
vs. +3.2% nominal annualized
Year-by-Year (Inflation-Adjusted)
$1,000 in Japan (EWJ) since 2000, values in constant 2000 dollars
| Year | Nominal Value | Real Value (2000 $) |
|---|---|---|
| 2000 | $1,000 | $1,000 |
| 2001 | $778 | $758 |
| 2002 | $505 | $482 |
| 2003 | $479 | $447 |
| 2004 | $683 | $620 |
| 2005 | $752 | $660 |
| 2006 | $1,000 | $852 |
| 2007 | $1,028 | $849 |
| 2008 | $923 | $735 |
| 2009 | $620 | $496 |
| 2010 | $734 | $573 |
| 2011 | $827 | $620 |
| 2012 | $737 | $542 |
| 2013 | $786 | $565 |
| 2014 | $903 | $641 |
| 2015 | $928 | $658 |
| 2016 | $940 | $657 |
| 2017 | $1,054 | $720 |
| 2018 | $1,329 | $881 |
| 2019 | $1,164 | $754 |
| 2020 | $1,264 | $806 |
| 2021 | $1,484 | $901 |
| 2022 | $1,449 | $806 |
| 2023 | $1,343 | $719 |
| 2024 | $1,547 | $805 |
| 2025 | $1,633 | $833 |
| 2026 | $2,143 | $1,093 |
Inflation adjustment uses BLS CPI-U annual data, deflated to 2026 dollars. Nominal stock data from Yahoo Finance (split-adjusted closing prices). Real values are expressed in constant 2000 purchasing-power dollars. For informational and educational purposes only. Not financial advice. Past performance does not guarantee future results. See our methodology and full disclaimer.