What if you invested $1,000 in Johnson & Johnson in 2010? (Inflation-Adjusted)
JNJ · Healthcare · Adjusted to 2026 dollars using BLS CPI-U data
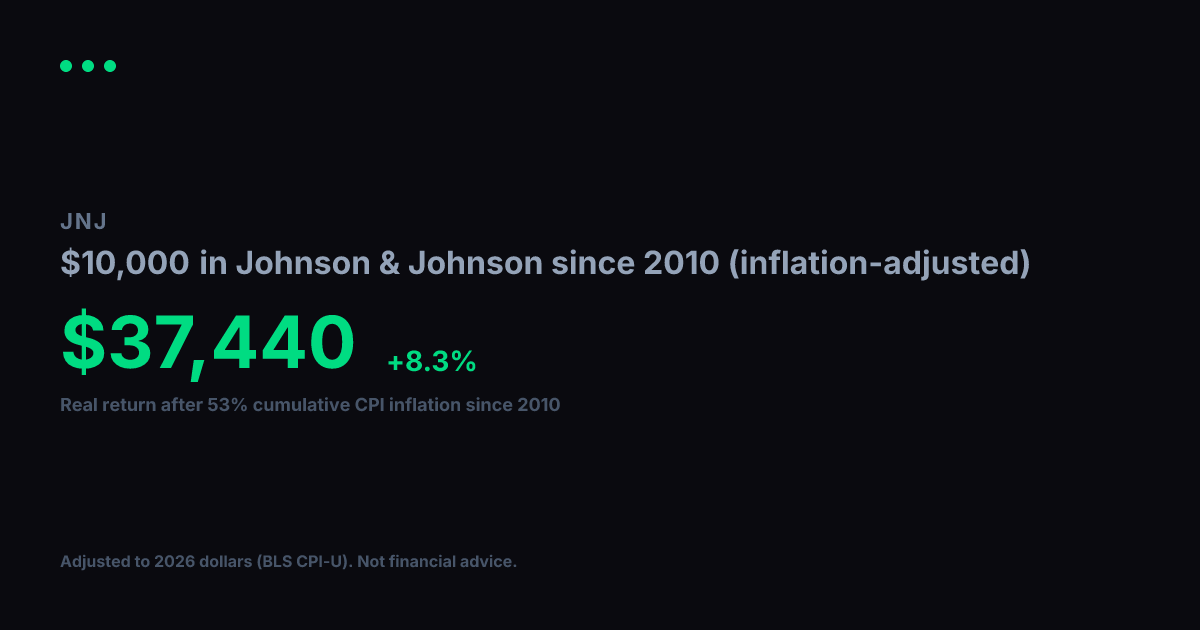
View nominal (non-adjusted) versionJohnson & Johnson turned $1,000 into $6,537 between 2010 and today. Impressive on paper, but inflation over that span came to 53% (BLS CPI-U). Adjusted for that erosion in purchasing power, your real gain in constant 2010 dollars is $4,273, which works out to a +9.1% annualized real growth rate over 17 years.
Nominal final value
$6,537
+553.7% total return
Real value (2010 dollars)
$4,273
+327.3% real total return
Real annualized return
+9.1%
vs. +12% nominal annualized
Year-by-Year (Inflation-Adjusted)
$1,000 in Johnson & Johnson since 2010, values in constant 2010 dollars
| Year | Nominal Value | Real Value (2010 $) |
|---|---|---|
| 2010 | $1,000 | $1,000 |
| 2011 | $984 | $946 |
| 2012 | $1,125 | $1,059 |
| 2013 | $1,308 | $1,206 |
| 2014 | $1,614 | $1,466 |
| 2015 | $1,877 | $1,705 |
| 2016 | $2,016 | $1,805 |
| 2017 | $2,247 | $1,968 |
| 2018 | $2,814 | $2,391 |
| 2019 | $2,783 | $2,310 |
| 2020 | $3,201 | $2,615 |
| 2021 | $3,603 | $2,802 |
| 2022 | $3,901 | $2,779 |
| 2023 | $3,798 | $2,606 |
| 2024 | $3,805 | $2,536 |
| 2025 | $3,758 | $2,456 |
| 2026 | $5,785 | $3,781 |
Inflation adjustment uses BLS CPI-U annual data, deflated to 2026 dollars. Nominal stock data from Yahoo Finance (split-adjusted closing prices). Real values are expressed in constant 2010 purchasing-power dollars. For informational and educational purposes only. Not financial advice. Past performance does not guarantee future results. See our methodology and full disclaimer.