What if you invested $1,000 in Lockheed Martin in 2010? (Inflation-Adjusted)
LMT · Industrial · Adjusted to 2026 dollars using BLS CPI-U data
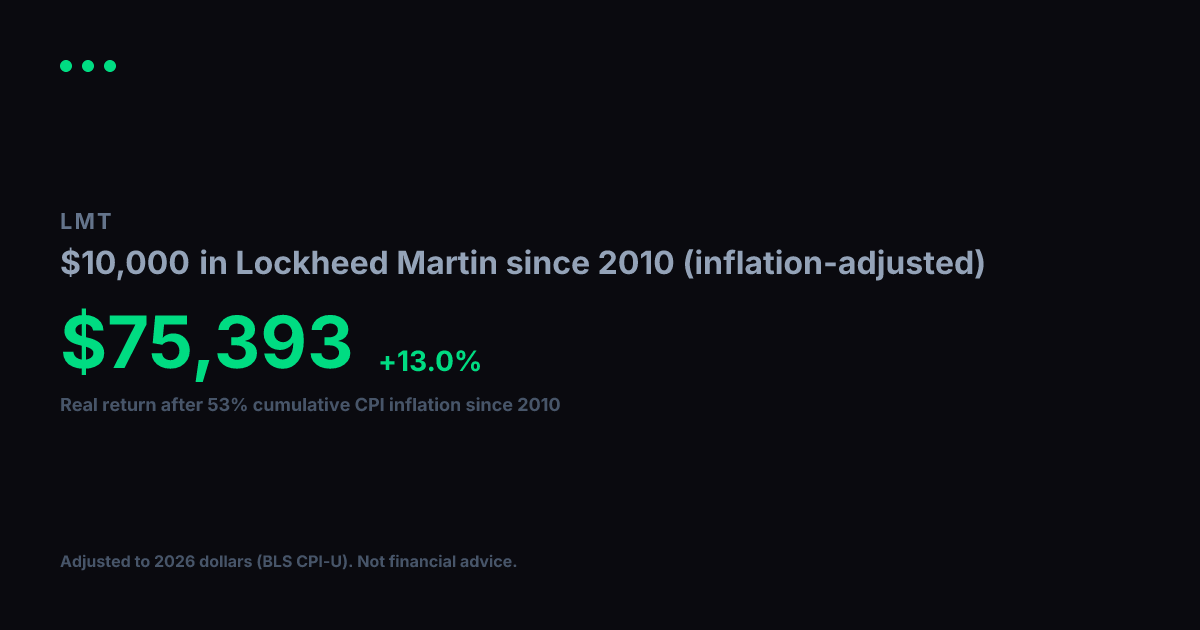
View nominal (non-adjusted) versionLockheed Martin turned $1,000 into $11,290 between 2010 and today. Impressive on paper, but inflation over that span came to 53% (BLS CPI-U). Adjusted for that erosion in purchasing power, your real gain in constant 2010 dollars is $7,379, which works out to a +12.8% annualized real growth rate over 17 years.
Nominal final value
$11,290
+1029.0% total return
Real value (2010 dollars)
$7,379
+637.9% real total return
Real annualized return
+12.8%
vs. +15.7% nominal annualized
Year-by-Year (Inflation-Adjusted)
$1,000 in Lockheed Martin since 2010, values in constant 2010 dollars
| Year | Nominal Value | Real Value (2010 $) |
|---|---|---|
| 2010 | $1,000 | $1,000 |
| 2011 | $1,107 | $1,064 |
| 2012 | $1,194 | $1,124 |
| 2013 | $1,320 | $1,217 |
| 2014 | $2,394 | $2,175 |
| 2015 | $3,085 | $2,803 |
| 2016 | $3,561 | $3,189 |
| 2017 | $4,362 | $3,820 |
| 2018 | $6,318 | $5,368 |
| 2019 | $5,290 | $4,391 |
| 2020 | $8,020 | $6,552 |
| 2021 | $6,184 | $4,809 |
| 2022 | $7,703 | $5,488 |
| 2023 | $9,412 | $6,459 |
| 2024 | $8,960 | $5,974 |
| 2025 | $9,913 | $6,479 |
| 2026 | $13,981 | $9,138 |
Inflation adjustment uses BLS CPI-U annual data, deflated to 2026 dollars. Nominal stock data from Yahoo Finance (split-adjusted closing prices). Real values are expressed in constant 2010 purchasing-power dollars. For informational and educational purposes only. Not financial advice. Past performance does not guarantee future results. See our methodology and full disclaimer.