What if you invested $1,000 in McDonald's in 2000? (Inflation-Adjusted)
MCD · Consumer · Adjusted to 2026 dollars using BLS CPI-U data
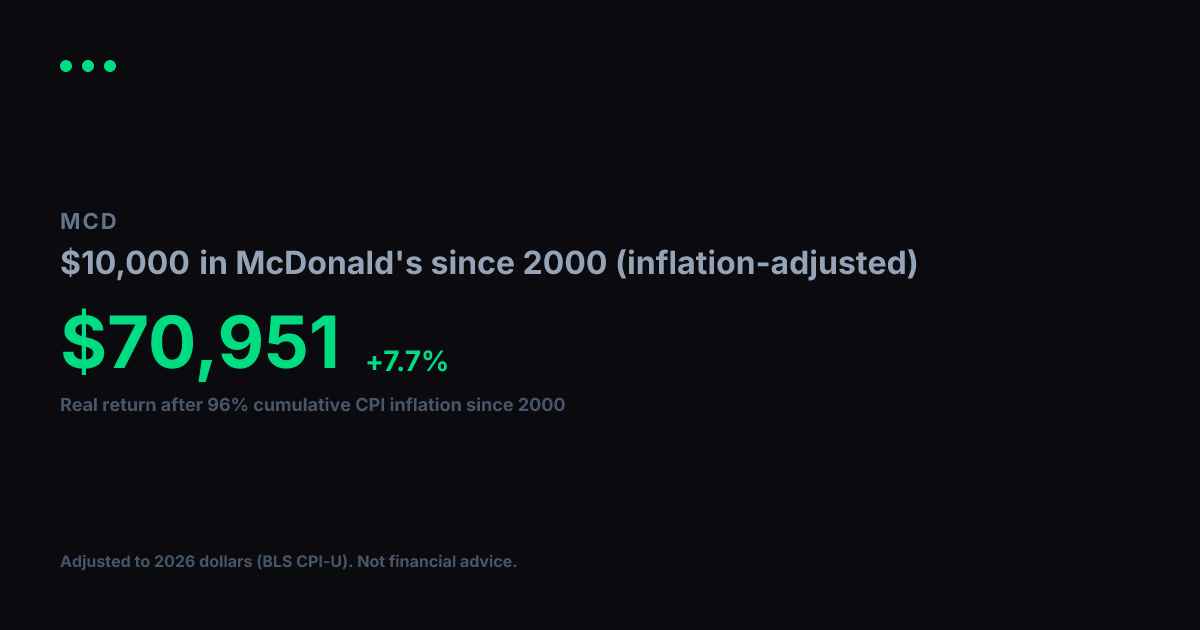
View nominal (non-adjusted) versionA $1,000 investment in McDonald's in 2000 grew to $13,696 in nominal terms. But 2000 dollars had 96% more purchasing power than today. After adjusting for cumulative inflation using BLS CPI-U data, the real value of that growth works out to $6,988 in constant 2000 dollars, equivalent to a +7.6% real annualized return.
Nominal final value
$13,696
+1269.6% total return
Real value (2000 dollars)
$6,988
+598.8% real total return
Real annualized return
+7.6%
vs. +10.3% nominal annualized
Year-by-Year (Inflation-Adjusted)
$1,000 in McDonald's since 2000, values in constant 2000 dollars
| Year | Nominal Value | Real Value (2000 $) |
|---|---|---|
| 2000 | $1,000 | $1,000 |
| 2001 | $790 | $770 |
| 2002 | $738 | $704 |
| 2003 | $392 | $366 |
| 2004 | $720 | $654 |
| 2005 | $923 | $810 |
| 2006 | $1,018 | $867 |
| 2007 | $1,321 | $1,092 |
| 2008 | $1,638 | $1,303 |
| 2009 | $1,824 | $1,461 |
| 2010 | $2,032 | $1,586 |
| 2011 | $2,476 | $1,857 |
| 2012 | $3,430 | $2,520 |
| 2013 | $3,406 | $2,450 |
| 2014 | $3,476 | $2,465 |
| 2015 | $3,530 | $2,503 |
| 2016 | $4,889 | $3,417 |
| 2017 | $4,990 | $3,412 |
| 2018 | $7,148 | $4,741 |
| 2019 | $7,656 | $4,961 |
| 2020 | $9,384 | $5,985 |
| 2021 | $9,342 | $5,672 |
| 2022 | $11,929 | $6,634 |
| 2023 | $12,570 | $6,734 |
| 2024 | $14,072 | $7,323 |
| 2025 | $14,215 | $7,253 |
| 2026 | $15,872 | $8,098 |
Inflation adjustment uses BLS CPI-U annual data, deflated to 2026 dollars. Nominal stock data from Yahoo Finance (split-adjusted closing prices). Real values are expressed in constant 2000 purchasing-power dollars. For informational and educational purposes only. Not financial advice. Past performance does not guarantee future results. See our methodology and full disclaimer.