What if you invested $1,000 in Monster Beverage in 1995? (Inflation-Adjusted)
MNST · Consumer · Adjusted to 2026 dollars using BLS CPI-U data
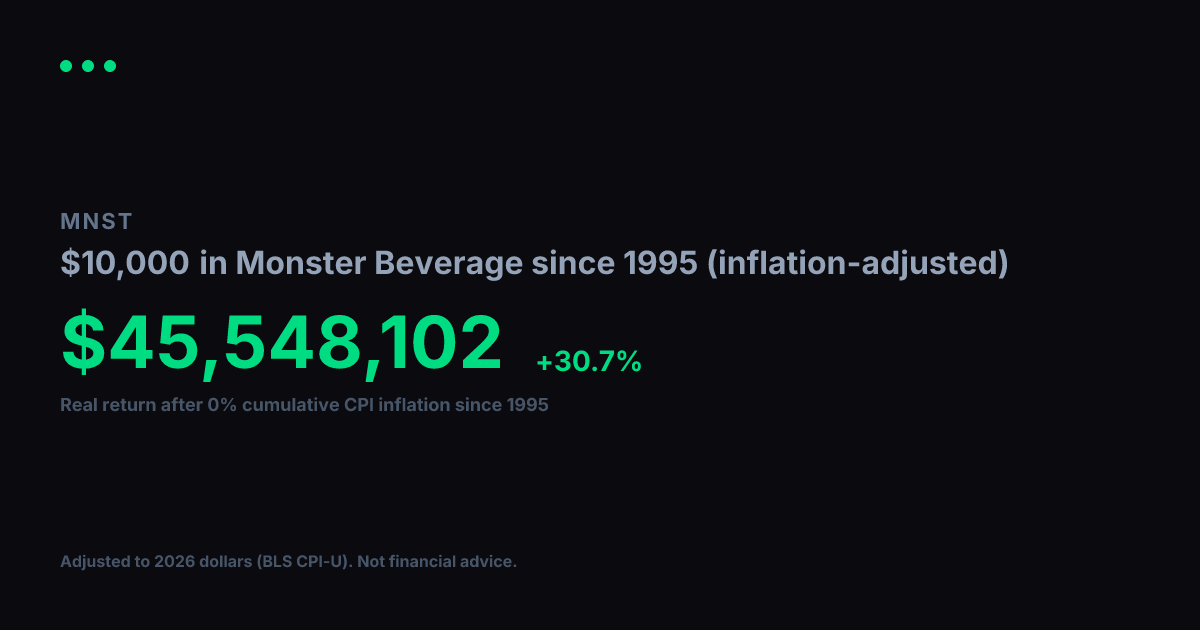
View nominal (non-adjusted) versionNominal returns can be misleading over long periods. $1,000 in Monster Beverage in 1995 became $4.92M by 2026. Over those 32 years, cumulative CPI inflation reached 0% (BLS CPI-U). Restating the return in constant purchasing power, the real value of your gain in 1995 dollars is $4.92M, a real annualized return of +30.9%.
Nominal final value
$4.92M
+492,041% total return
Real value (1995 dollars)
$4.92M
+492,041% real total return
Real annualized return
+30.9%
vs. +30.9% nominal annualized
Year-by-Year (Inflation-Adjusted)
$1,000 in Monster Beverage since 1995, values in constant 1995 dollars
| Year | Nominal Value | Real Value (1995 $) |
|---|---|---|
| 1995 | $1,000 | $1,000 |
| 1996 | $400 | $400 |
| 1997 | $567 | $567 |
| 1998 | $850 | $850 |
| 1999 | $2,433 | $2,433 |
| 2000 | $2,400 | $4,704 |
| 2001 | $2,167 | $4,138 |
| 2002 | $2,219 | $4,149 |
| 2003 | $2,293 | $4,197 |
| 2004 | $4,800 | $8,544 |
| 2005 | $21,814 | $37,519 |
| 2006 | $93,655 | $156,403 |
| 2007 | $162,519 | $263,281 |
| 2008 | $164,525 | $256,659 |
| 2009 | $142,935 | $224,408 |
| 2010 | $164,055 | $251,005 |
| 2011 | $241,667 | $355,251 |
| 2012 | $445,915 | $642,118 |
| 2013 | $408,752 | $576,340 |
| 2014 | $579,421 | $805,395 |
| 2015 | $997,986 | $1,387,201 |
| 2016 | $1,152,271 | $1,578,611 |
| 2017 | $1,090,574 | $1,461,369 |
| 2018 | $1,746,710 | $2,270,724 |
| 2019 | $1,465,363 | $1,861,011 |
| 2020 | $1,704,982 | $2,131,227 |
| 2021 | $2,222,876 | $2,645,223 |
| 2022 | $2,220,060 | $2,419,866 |
| 2023 | $2,664,482 | $2,797,706 |
| 2024 | $2,817,060 | $2,873,401 |
| 2025 | $2,493,984 | $2,493,984 |
| 2026 | $4,134,965 | $4,134,965 |
Inflation adjustment uses BLS CPI-U annual data, deflated to 2026 dollars. Nominal stock data from Yahoo Finance (split-adjusted closing prices). Real values are expressed in constant 1995 purchasing-power dollars. For informational and educational purposes only. Not financial advice. Past performance does not guarantee future results. See our methodology and full disclaimer.