What if you invested $1,000 in Morgan Stanley in 2005? (Inflation-Adjusted)
MS · Financial · Adjusted to 2026 dollars using BLS CPI-U data
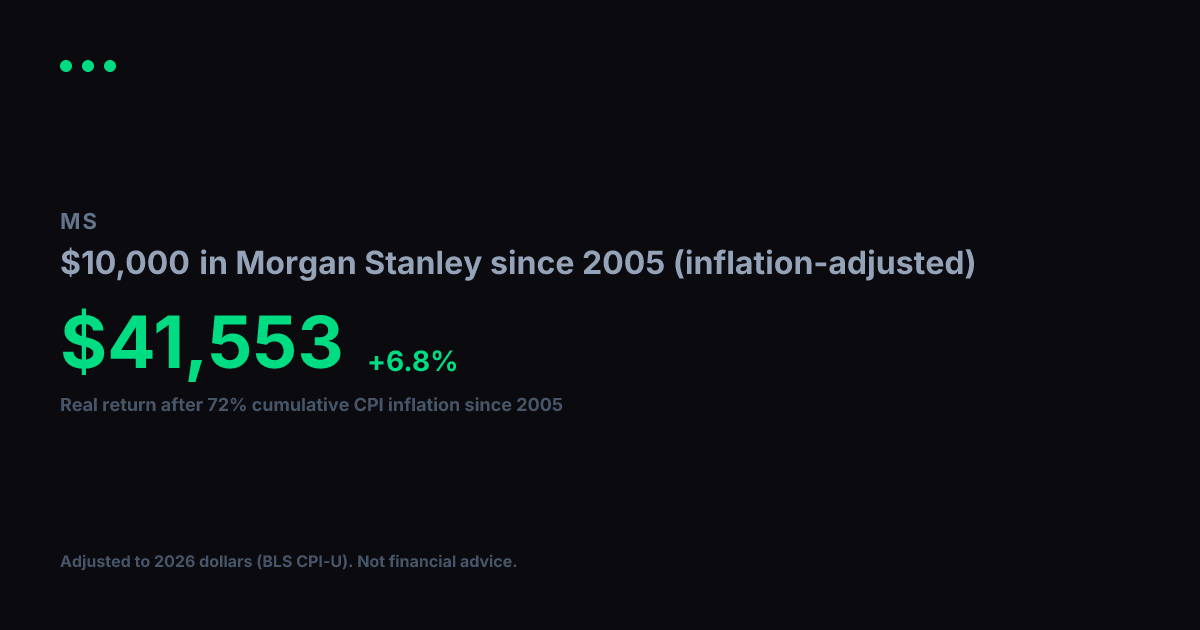
View nominal (non-adjusted) versionUsing BLS CPI-U data, cumulative inflation from 2005 to 2026 totals 72%. Your $1,000 in Morgan Stanley grew to $7,126 in raw dollar terms, but in real purchasing power terms that gain is equivalent to $4,143 in constant 2005 dollars. That reflects a +6.8% per year real annualized return after accounting for price changes over 22 years.
Nominal final value
$7,126
+612.6% total return
Real value (2005 dollars)
$4,143
+314.3% real total return
Real annualized return
+6.8%
vs. +9.5% nominal annualized
Year-by-Year (Inflation-Adjusted)
$1,000 in Morgan Stanley since 2005, values in constant 2005 dollars
| Year | Nominal Value | Real Value (2005 $) |
|---|---|---|
| 2005 | $1,000 | $1,000 |
| 2006 | $1,120 | $1,088 |
| 2007 | $1,535 | $1,445 |
| 2008 | $1,118 | $1,014 |
| 2009 | $473 | $432 |
| 2010 | $639 | $568 |
| 2011 | $706 | $604 |
| 2012 | $452 | $379 |
| 2013 | $561 | $460 |
| 2014 | $730 | $590 |
| 2015 | $846 | $684 |
| 2016 | $657 | $524 |
| 2017 | $1,106 | $862 |
| 2018 | $1,501 | $1,134 |
| 2019 | $1,147 | $847 |
| 2020 | $1,459 | $1,060 |
| 2021 | $1,928 | $1,334 |
| 2022 | $3,018 | $1,913 |
| 2023 | $2,966 | $1,810 |
| 2024 | $2,761 | $1,638 |
| 2025 | $4,541 | $2,640 |
| 2026 | $6,165 | $3,584 |
Inflation adjustment uses BLS CPI-U annual data, deflated to 2026 dollars. Nominal stock data from Yahoo Finance (split-adjusted closing prices). Real values are expressed in constant 2005 purchasing-power dollars. For informational and educational purposes only. Not financial advice. Past performance does not guarantee future results. See our methodology and full disclaimer.