What if you invested $1,000 in Nasdaq 100 (QQQ) in 1999? (Inflation-Adjusted)
QQQ · Index · Adjusted to 2026 dollars using BLS CPI-U data
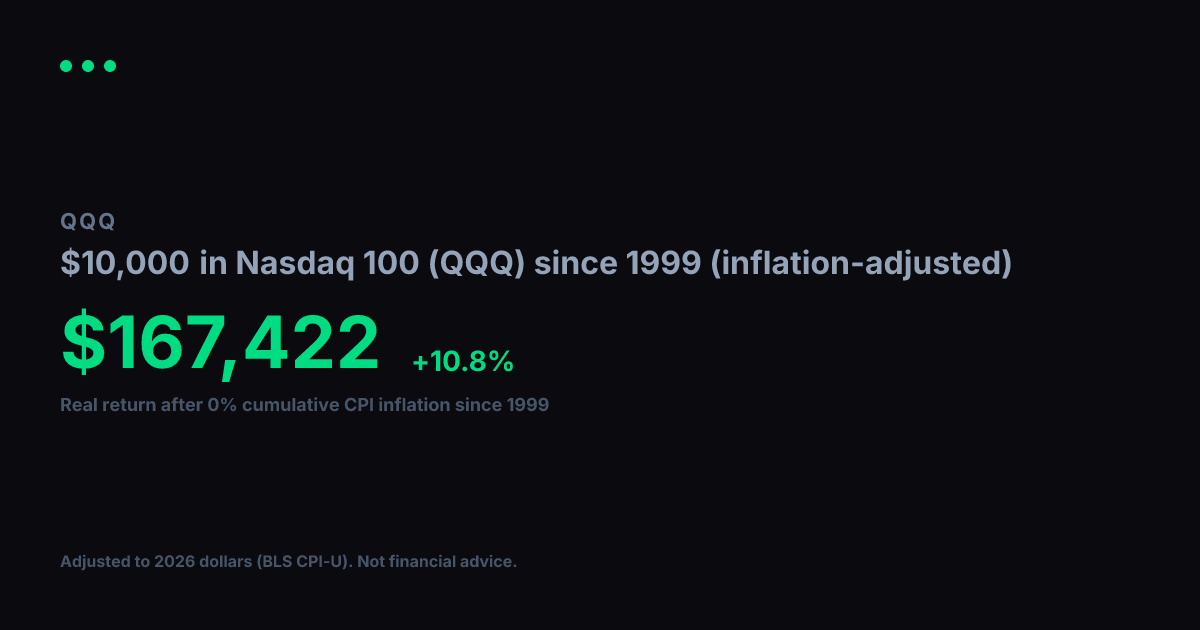
View nominal (non-adjusted) versionNominal returns can be misleading over long periods. $1,000 in Nasdaq 100 (QQQ) in 1999 became $16,638 by 2026. Over those 28 years, cumulative CPI inflation reached 0% (BLS CPI-U). Restating the return in constant purchasing power, the real value of your gain in 1999 dollars is $16,638, a real annualized return of +10.7%.
Nominal final value
$16,638
+1563.8% total return
Real value (1999 dollars)
$16,638
+1563.8% real total return
Real annualized return
+10.7%
vs. +10.7% nominal annualized
Year-by-Year (Inflation-Adjusted)
$1,000 in Nasdaq 100 (QQQ) since 1999, values in constant 1999 dollars
| Year | Nominal Value | Real Value (1999 $) |
|---|---|---|
| 1999 | $1,000 | $1,000 |
| 2000 | $1,709 | $3,350 |
| 2001 | $1,225 | $2,341 |
| 2002 | $734 | $1,373 |
| 2003 | $466 | $852 |
| 2004 | $707 | $1,258 |
| 2005 | $720 | $1,238 |
| 2006 | $811 | $1,355 |
| 2007 | $854 | $1,383 |
| 2008 | $877 | $1,368 |
| 2009 | $567 | $890 |
| 2010 | $839 | $1,284 |
| 2011 | $1,108 | $1,629 |
| 2012 | $1,209 | $1,741 |
| 2013 | $1,353 | $1,907 |
| 2014 | $1,765 | $2,454 |
| 2015 | $2,101 | $2,920 |
| 2016 | $2,185 | $2,994 |
| 2017 | $2,644 | $3,542 |
| 2018 | $3,628 | $4,716 |
| 2019 | $3,632 | $4,612 |
| 2020 | $4,770 | $5,962 |
| 2021 | $6,888 | $8,197 |
| 2022 | $7,988 | $8,707 |
| 2023 | $6,530 | $6,857 |
| 2024 | $9,306 | $9,492 |
| 2025 | $11,726 | $11,726 |
| 2026 | $14,033 | $14,033 |
Inflation adjustment uses BLS CPI-U annual data, deflated to 2026 dollars. Nominal stock data from Yahoo Finance (split-adjusted closing prices). Real values are expressed in constant 1999 purchasing-power dollars. For informational and educational purposes only. Not financial advice. Past performance does not guarantee future results. See our methodology and full disclaimer.