What if you invested $1,000 in NextEra Energy in 2010? (Inflation-Adjusted)
NEE · Energy · Adjusted to 2026 dollars using BLS CPI-U data
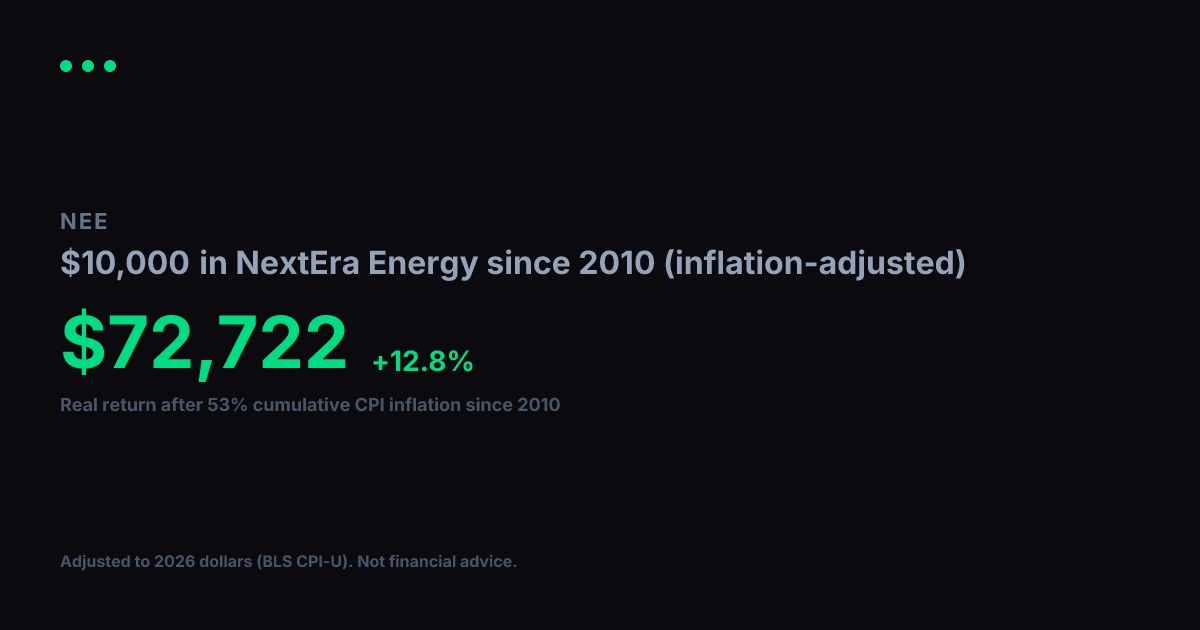
View nominal (non-adjusted) versionNextEra Energy turned $1,000 into $11,561 between 2010 and today. Impressive on paper, but inflation over that span came to 53% (BLS CPI-U). Adjusted for that erosion in purchasing power, your real gain in constant 2010 dollars is $7,556, which works out to a +13.0% annualized real growth rate over 17 years.
Nominal final value
$11,561
+1056.1% total return
Real value (2010 dollars)
$7,556
+655.6% real total return
Real annualized return
+13.0%
vs. +15.9% nominal annualized
Year-by-Year (Inflation-Adjusted)
$1,000 in NextEra Energy since 2010, values in constant 2010 dollars
| Year | Nominal Value | Real Value (2010 $) |
|---|---|---|
| 2010 | $1,000 | $1,000 |
| 2011 | $1,141 | $1,096 |
| 2012 | $1,329 | $1,251 |
| 2013 | $1,661 | $1,530 |
| 2014 | $2,192 | $1,991 |
| 2015 | $2,684 | $2,438 |
| 2016 | $2,829 | $2,533 |
| 2017 | $3,227 | $2,826 |
| 2018 | $4,247 | $3,608 |
| 2019 | $4,928 | $4,091 |
| 2020 | $7,563 | $6,179 |
| 2021 | $9,310 | $7,241 |
| 2022 | $9,171 | $6,533 |
| 2023 | $8,948 | $6,141 |
| 2024 | $7,228 | $4,819 |
| 2025 | $9,079 | $5,934 |
| 2026 | $11,500 | $7,516 |
Inflation adjustment uses BLS CPI-U annual data, deflated to 2026 dollars. Nominal stock data from Yahoo Finance (split-adjusted closing prices). Real values are expressed in constant 2010 purchasing-power dollars. For informational and educational purposes only. Not financial advice. Past performance does not guarantee future results. See our methodology and full disclaimer.