What if you invested $1,000 in Nvidia in 2000? (Inflation-Adjusted)
NVDA · Technology · Adjusted to 2026 dollars using BLS CPI-U data
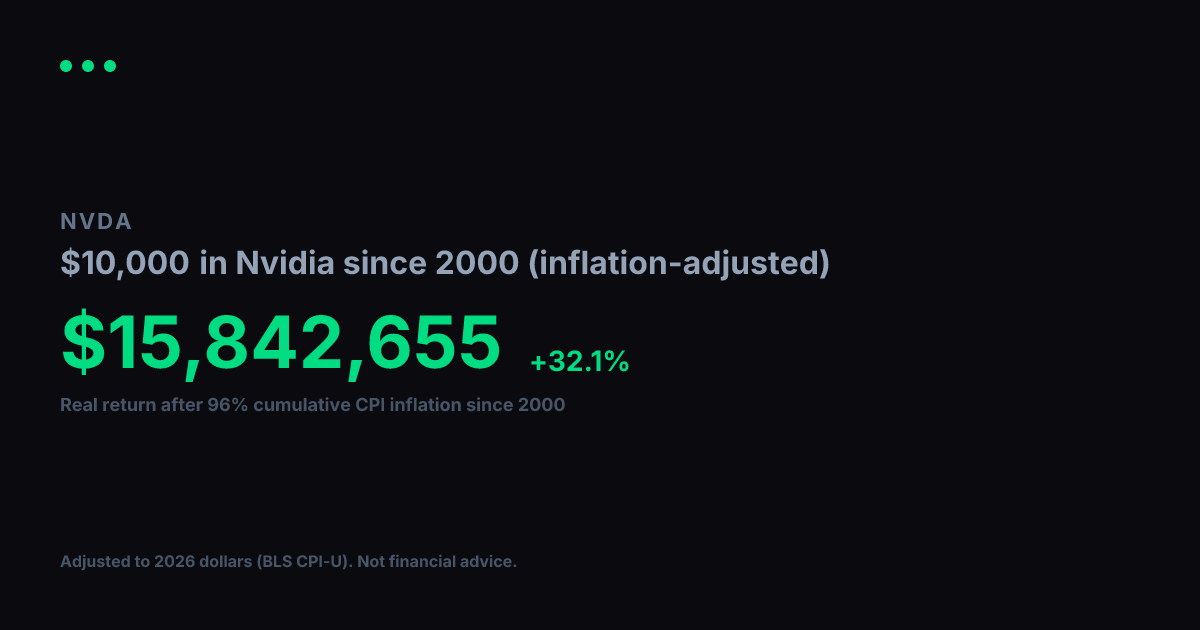
View nominal (non-adjusted) versionA $1,000 investment in Nvidia in 2000 grew to $2.83M in nominal terms. But 2000 dollars had 96% more purchasing power than today. After adjusting for cumulative inflation using BLS CPI-U data, the real value of that growth works out to $1.44M in constant 2000 dollars, equivalent to a +31.4% real annualized return.
Nominal final value
$2.83M
+282,558% total return
Real value (2000 dollars)
$1.44M
+144,113% real total return
Real annualized return
+31.4%
vs. +34.8% nominal annualized
Year-by-Year (Inflation-Adjusted)
$1,000 in Nvidia since 2000, values in constant 2000 dollars
| Year | Nominal Value | Real Value (2000 $) |
|---|---|---|
| 2000 | $1,000 | $1,000 |
| 2001 | $2,786 | $2,715 |
| 2002 | $7,095 | $6,769 |
| 2003 | $1,114 | $1,040 |
| 2004 | $2,401 | $2,181 |
| 2005 | $2,474 | $2,171 |
| 2006 | $4,852 | $4,134 |
| 2007 | $6,616 | $5,468 |
| 2008 | $7,962 | $6,337 |
| 2009 | $2,574 | $2,062 |
| 2010 | $4,983 | $3,890 |
| 2011 | $7,745 | $5,809 |
| 2012 | $4,782 | $3,513 |
| 2013 | $3,995 | $2,874 |
| 2014 | $5,228 | $3,708 |
| 2015 | $6,508 | $4,615 |
| 2016 | $10,092 | $7,054 |
| 2017 | $37,981 | $25,967 |
| 2018 | $85,841 | $56,936 |
| 2019 | $50,342 | $32,620 |
| 2020 | $83,123 | $53,012 |
| 2021 | $182,976 | $111,093 |
| 2022 | $345,216 | $191,982 |
| 2023 | $275,700 | $147,696 |
| 2024 | $868,634 | $452,044 |
| 2025 | $1,695,620 | $865,112 |
| 2026 | $2,699,863 | $1,377,481 |
Inflation adjustment uses BLS CPI-U annual data, deflated to 2026 dollars. Nominal stock data from Yahoo Finance (split-adjusted closing prices). Real values are expressed in constant 2000 purchasing-power dollars. For informational and educational purposes only. Not financial advice. Past performance does not guarantee future results. See our methodology and full disclaimer.