What if you invested $1,000 in Nvidia in 2010? (Inflation-Adjusted)
NVDA · Technology · Adjusted to 2026 dollars using BLS CPI-U data
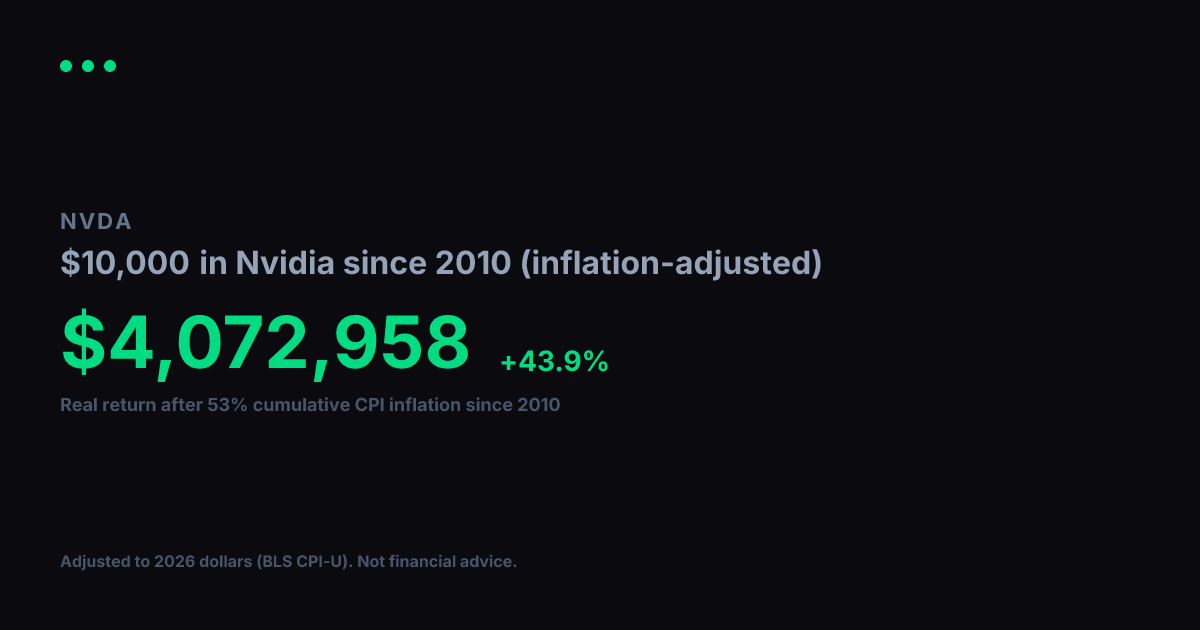
View nominal (non-adjusted) versionNvidia turned $1,000 into $567,256 between 2010 and today. Impressive on paper, but inflation over that span came to 53% (BLS CPI-U). Adjusted for that erosion in purchasing power, your real gain in constant 2010 dollars is $370,756, which works out to a +42.8% annualized real growth rate over 17 years.
Nominal final value
$567,256
+56,626% total return
Real value (2010 dollars)
$370,756
+36,976% real total return
Real annualized return
+42.8%
vs. +46.6% nominal annualized
Year-by-Year (Inflation-Adjusted)
$1,000 in Nvidia since 2010, values in constant 2010 dollars
| Year | Nominal Value | Real Value (2010 $) |
|---|---|---|
| 2010 | $1,000 | $1,000 |
| 2011 | $1,554 | $1,493 |
| 2012 | $960 | $903 |
| 2013 | $802 | $739 |
| 2014 | $1,049 | $953 |
| 2015 | $1,306 | $1,187 |
| 2016 | $2,025 | $1,814 |
| 2017 | $7,622 | $6,676 |
| 2018 | $17,227 | $14,637 |
| 2019 | $10,103 | $8,386 |
| 2020 | $16,682 | $13,629 |
| 2021 | $36,721 | $28,561 |
| 2022 | $69,280 | $49,356 |
| 2023 | $55,329 | $37,971 |
| 2024 | $174,323 | $116,215 |
| 2025 | $340,288 | $222,410 |
| 2026 | $541,825 | $354,134 |
Inflation adjustment uses BLS CPI-U annual data, deflated to 2026 dollars. Nominal stock data from Yahoo Finance (split-adjusted closing prices). Real values are expressed in constant 2010 purchasing-power dollars. For informational and educational purposes only. Not financial advice. Past performance does not guarantee future results. See our methodology and full disclaimer.