What if you invested $1,000 in PepsiCo in 2005? (Inflation-Adjusted)
PEP · Consumer · Adjusted to 2026 dollars using BLS CPI-U data
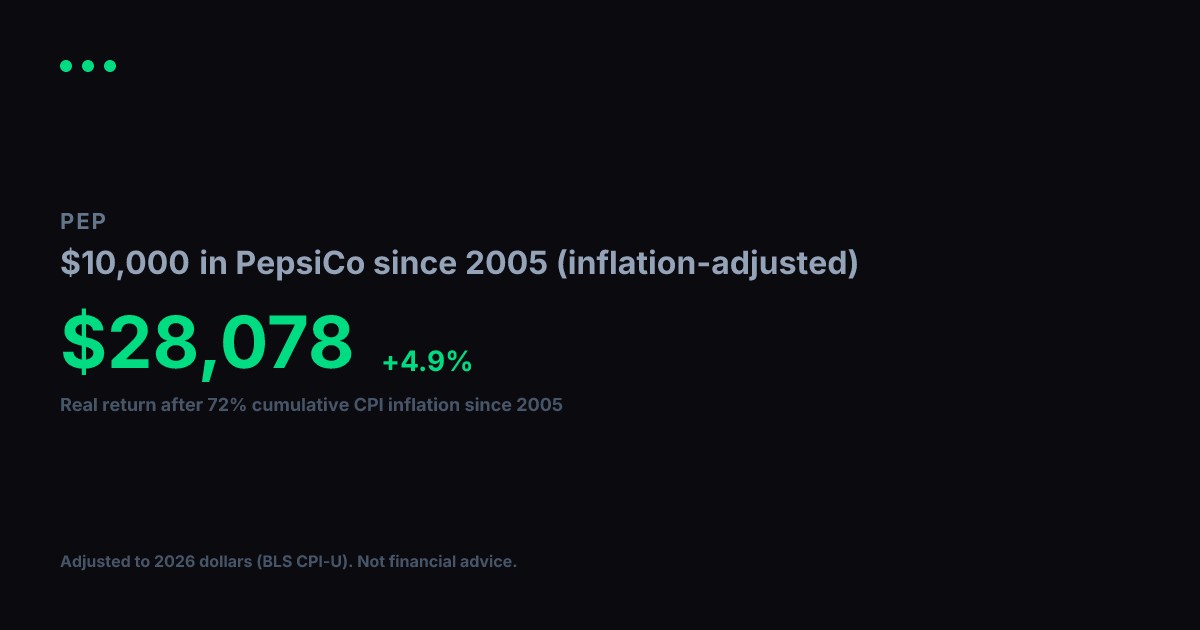
View nominal (non-adjusted) versionUsing BLS CPI-U data, cumulative inflation from 2005 to 2026 totals 72%. Your $1,000 in PepsiCo grew to $4,605 in raw dollar terms, but in real purchasing power terms that gain is equivalent to $2,677 in constant 2005 dollars. That reflects a +4.7% per year real annualized return after accounting for price changes over 22 years.
Nominal final value
$4,605
+360.5% total return
Real value (2005 dollars)
$2,677
+167.7% real total return
Real annualized return
+4.7%
vs. +7.3% nominal annualized
Year-by-Year (Inflation-Adjusted)
$1,000 in PepsiCo since 2005, values in constant 2005 dollars
| Year | Nominal Value | Real Value (2005 $) |
|---|---|---|
| 2005 | $1,000 | $1,000 |
| 2006 | $1,084 | $1,053 |
| 2007 | $1,260 | $1,187 |
| 2008 | $1,342 | $1,217 |
| 2009 | $1,016 | $928 |
| 2010 | $1,246 | $1,108 |
| 2011 | $1,384 | $1,183 |
| 2012 | $1,458 | $1,221 |
| 2013 | $1,669 | $1,368 |
| 2014 | $1,893 | $1,530 |
| 2015 | $2,272 | $1,836 |
| 2016 | $2,476 | $1,972 |
| 2017 | $2,664 | $2,075 |
| 2018 | $3,174 | $2,399 |
| 2019 | $3,072 | $2,268 |
| 2020 | $3,987 | $2,897 |
| 2021 | $3,945 | $2,730 |
| 2022 | $5,159 | $3,270 |
| 2023 | $5,221 | $3,187 |
| 2024 | $5,293 | $3,139 |
| 2025 | $4,884 | $2,840 |
| 2026 | $5,178 | $3,011 |
Inflation adjustment uses BLS CPI-U annual data, deflated to 2026 dollars. Nominal stock data from Yahoo Finance (split-adjusted closing prices). Real values are expressed in constant 2005 purchasing-power dollars. For informational and educational purposes only. Not financial advice. Past performance does not guarantee future results. See our methodology and full disclaimer.