What if you invested $1,000 in PepsiCo in 2010? (Inflation-Adjusted)
PEP · Consumer · Adjusted to 2026 dollars using BLS CPI-U data
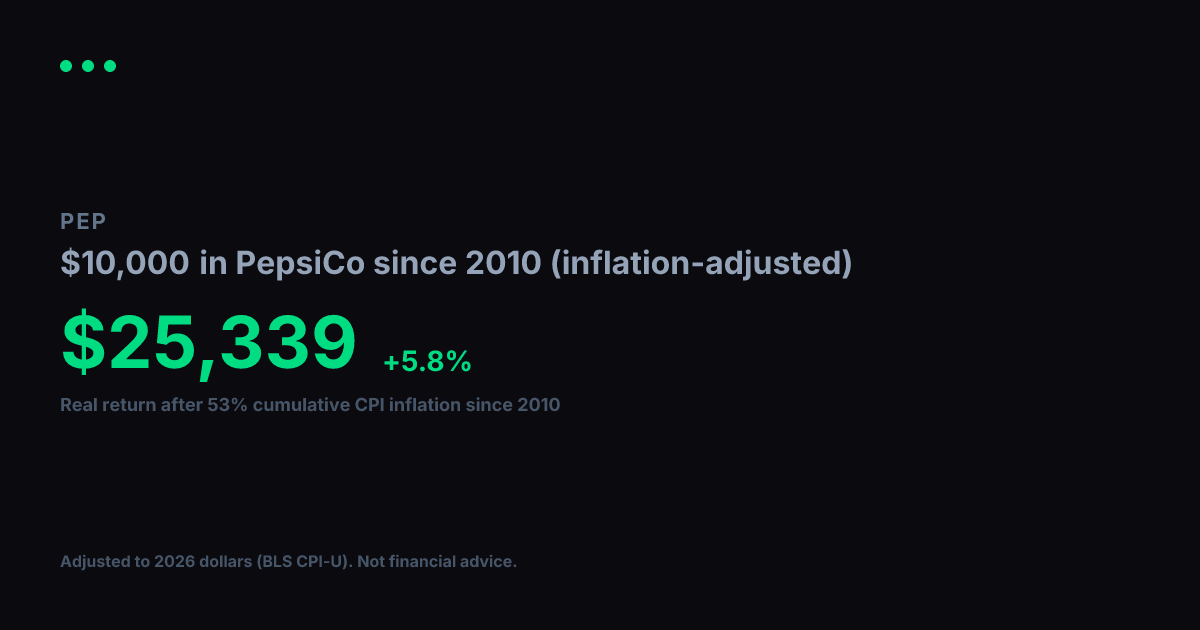
View nominal (non-adjusted) versionPepsiCo turned $1,000 into $3,696 between 2010 and today. Impressive on paper, but inflation over that span came to 53% (BLS CPI-U). Adjusted for that erosion in purchasing power, your real gain in constant 2010 dollars is $2,416, which works out to a +5.5% annualized real growth rate over 17 years.
Nominal final value
$3,696
+269.6% total return
Real value (2010 dollars)
$2,416
+141.6% real total return
Real annualized return
+5.5%
vs. +8.2% nominal annualized
Year-by-Year (Inflation-Adjusted)
$1,000 in PepsiCo since 2010, values in constant 2010 dollars
| Year | Nominal Value | Real Value (2010 $) |
|---|---|---|
| 2010 | $1,000 | $1,000 |
| 2011 | $1,111 | $1,068 |
| 2012 | $1,170 | $1,102 |
| 2013 | $1,339 | $1,234 |
| 2014 | $1,520 | $1,381 |
| 2015 | $1,824 | $1,657 |
| 2016 | $1,988 | $1,780 |
| 2017 | $2,138 | $1,873 |
| 2018 | $2,548 | $2,165 |
| 2019 | $2,466 | $2,047 |
| 2020 | $3,200 | $2,615 |
| 2021 | $3,167 | $2,463 |
| 2022 | $4,142 | $2,951 |
| 2023 | $4,191 | $2,876 |
| 2024 | $4,249 | $2,832 |
| 2025 | $3,921 | $2,562 |
| 2026 | $4,157 | $2,717 |
Inflation adjustment uses BLS CPI-U annual data, deflated to 2026 dollars. Nominal stock data from Yahoo Finance (split-adjusted closing prices). Real values are expressed in constant 2010 purchasing-power dollars. For informational and educational purposes only. Not financial advice. Past performance does not guarantee future results. See our methodology and full disclaimer.