What if you invested $1,000 in Russell 2000 (IWM) in 2000? (Inflation-Adjusted)
IWM · Index · Adjusted to 2026 dollars using BLS CPI-U data
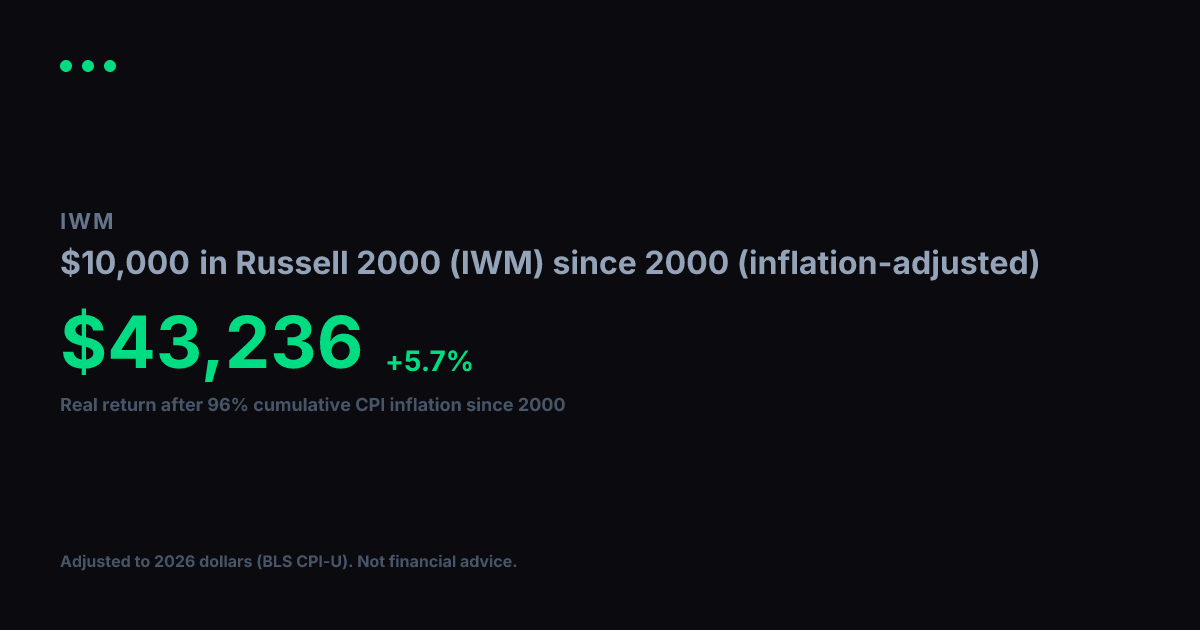
View nominal (non-adjusted) versionA $1,000 investment in Russell 2000 (IWM) in 2000 grew to $8,838 in nominal terms. But 2000 dollars had 96% more purchasing power than today. After adjusting for cumulative inflation using BLS CPI-U data, the real value of that growth works out to $4,509 in constant 2000 dollars, equivalent to a +5.8% real annualized return.
Nominal final value
$8,838
+783.8% total return
Real value (2000 dollars)
$4,509
+350.9% real total return
Real annualized return
+5.8%
vs. +8.5% nominal annualized
Year-by-Year (Inflation-Adjusted)
$1,000 in Russell 2000 (IWM) since 2000, values in constant 2000 dollars
| Year | Nominal Value | Real Value (2000 $) |
|---|---|---|
| 2000 | $1,000 | $1,000 |
| 2001 | $1,069 | $1,042 |
| 2002 | $1,031 | $984 |
| 2003 | $805 | $752 |
| 2004 | $1,269 | $1,153 |
| 2005 | $1,378 | $1,209 |
| 2006 | $1,627 | $1,386 |
| 2007 | $1,804 | $1,491 |
| 2008 | $1,629 | $1,296 |
| 2009 | $1,037 | $830 |
| 2010 | $1,420 | $1,108 |
| 2011 | $1,865 | $1,398 |
| 2012 | $1,916 | $1,408 |
| 2013 | $2,218 | $1,595 |
| 2014 | $2,815 | $1,996 |
| 2015 | $2,941 | $2,086 |
| 2016 | $2,656 | $1,856 |
| 2017 | $3,542 | $2,422 |
| 2018 | $4,151 | $2,753 |
| 2019 | $4,004 | $2,595 |
| 2020 | $4,370 | $2,787 |
| 2021 | $5,676 | $3,446 |
| 2022 | $5,609 | $3,119 |
| 2023 | $5,414 | $2,901 |
| 2024 | $5,535 | $2,881 |
| 2025 | $6,576 | $3,355 |
| 2026 | $7,624 | $3,890 |
Inflation adjustment uses BLS CPI-U annual data, deflated to 2026 dollars. Nominal stock data from Yahoo Finance (split-adjusted closing prices). Real values are expressed in constant 2000 purchasing-power dollars. For informational and educational purposes only. Not financial advice. Past performance does not guarantee future results. See our methodology and full disclaimer.