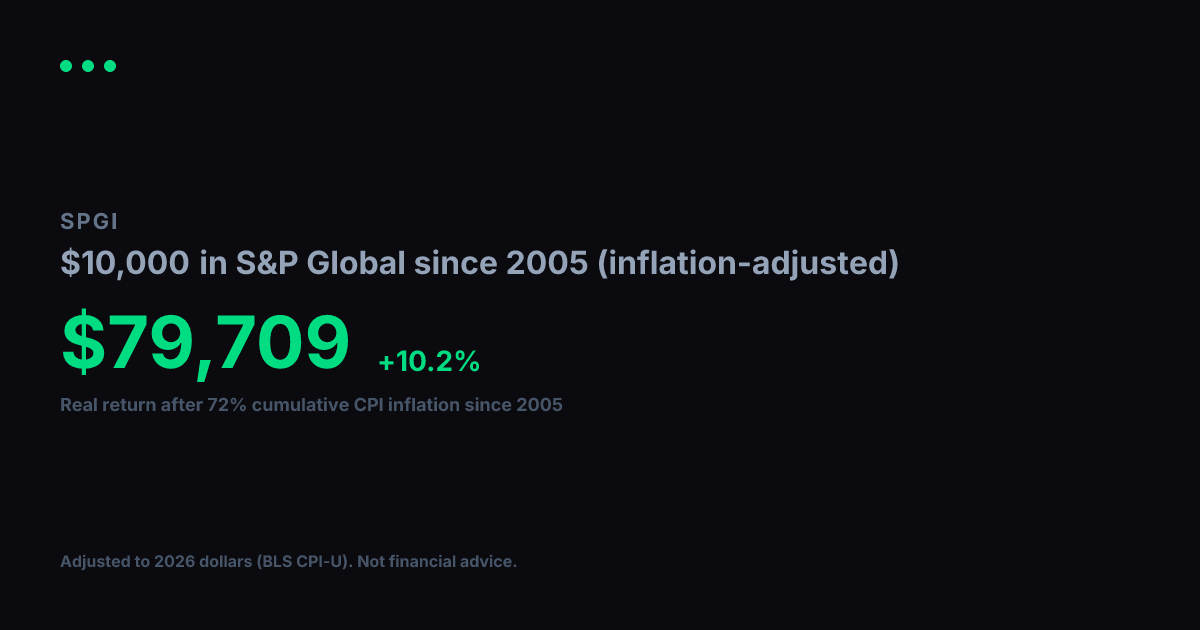
What if you invested $1,000 in S&P Global in 2005? (Inflation-Adjusted)
SPGI · Financial · Adjusted to 2026 dollars using BLS CPI-U data
View nominal (non-adjusted) versionUsing BLS CPI-U data, cumulative inflation from 2005 to 2026 totals 72%. Your $1,000 in S&P Global grew to $13,220 in raw dollar terms, but in real purchasing power terms that gain is equivalent to $7,686 in constant 2005 dollars. That reflects a +9.8% per year real annualized return after accounting for price changes over 22 years.
Nominal final value
$13,220
+1222.0% total return
Real value (2005 dollars)
$7,686
+668.6% real total return
Real annualized return
+9.8%
vs. +12.6% nominal annualized
Year-by-Year (Inflation-Adjusted)
$1,000 in S&P Global since 2005, values in constant 2005 dollars
| Year | Nominal Value | Real Value (2005 $) |
|---|---|---|
| 2005 | $1,000 | $1,000 |
| 2006 | $1,142 | $1,108 |
| 2007 | $1,520 | $1,432 |
| 2008 | $983 | $892 |
| 2009 | $520 | $474 |
| 2010 | $866 | $770 |
| 2011 | $981 | $839 |
| 2012 | $1,187 | $994 |
| 2013 | $1,589 | $1,302 |
| 2014 | $2,142 | $1,731 |
| 2015 | $2,557 | $2,066 |
| 2016 | $2,462 | $1,961 |
| 2017 | $3,527 | $2,748 |
| 2018 | $5,376 | $4,063 |
| 2019 | $5,749 | $4,245 |
| 2020 | $8,898 | $6,467 |
| 2021 | $9,683 | $6,700 |
| 2022 | $12,783 | $8,101 |
| 2023 | $11,647 | $7,110 |
| 2024 | $14,063 | $8,339 |
| 2025 | $16,482 | $9,582 |
| 2026 | $16,807 | $9,771 |
Inflation adjustment uses BLS CPI-U annual data, deflated to 2026 dollars. Nominal stock data from Yahoo Finance (split-adjusted closing prices). Real values are expressed in constant 2005 purchasing-power dollars. For informational and educational purposes only. Not financial advice. Past performance does not guarantee future results. See our methodology and full disclaimer.