What if you invested $1,000 in ServiceNow in 2015? (Inflation-Adjusted)
NOW · Technology · Adjusted to 2026 dollars using BLS CPI-U data
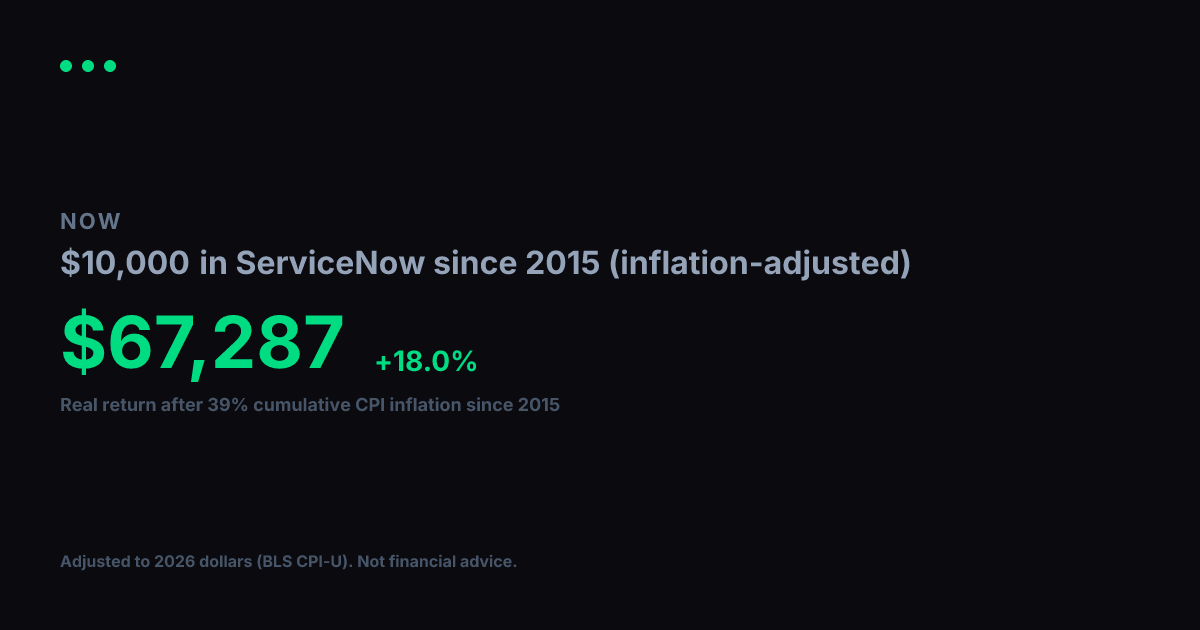
View nominal (non-adjusted) versionNominal returns can be misleading over long periods. $1,000 in ServiceNow in 2015 became $6,809 by 2026. Over those 12 years, cumulative CPI inflation reached 39% (BLS CPI-U). Restating the return in constant purchasing power, the real value of your gain in 2015 dollars is $4,899, a real annualized return of +14.7%.
Nominal final value
$6,809
+580.9% total return
Real value (2015 dollars)
$4,899
+389.9% real total return
Real annualized return
+14.7%
vs. +18% nominal annualized
Year-by-Year (Inflation-Adjusted)
$1,000 in ServiceNow since 2015, values in constant 2015 dollars
| Year | Nominal Value | Real Value (2015 $) |
|---|---|---|
| 2015 | $1,000 | $1,000 |
| 2016 | $853 | $841 |
| 2017 | $1,243 | $1,198 |
| 2018 | $2,042 | $1,910 |
| 2019 | $3,018 | $2,758 |
| 2020 | $4,640 | $4,172 |
| 2021 | $7,451 | $6,379 |
| 2022 | $8,035 | $6,301 |
| 2023 | $6,243 | $4,716 |
| 2024 | $10,499 | $7,705 |
| 2025 | $13,970 | $10,050 |
| 2026 | $8,025 | $5,774 |
Inflation adjustment uses BLS CPI-U annual data, deflated to 2026 dollars. Nominal stock data from Yahoo Finance (split-adjusted closing prices). Real values are expressed in constant 2015 purchasing-power dollars. For informational and educational purposes only. Not financial advice. Past performance does not guarantee future results. See our methodology and full disclaimer.