What if you invested $1,000 in Sherwin-Williams in 2000? (Inflation-Adjusted)
SHW · Industrial · Adjusted to 2026 dollars using BLS CPI-U data
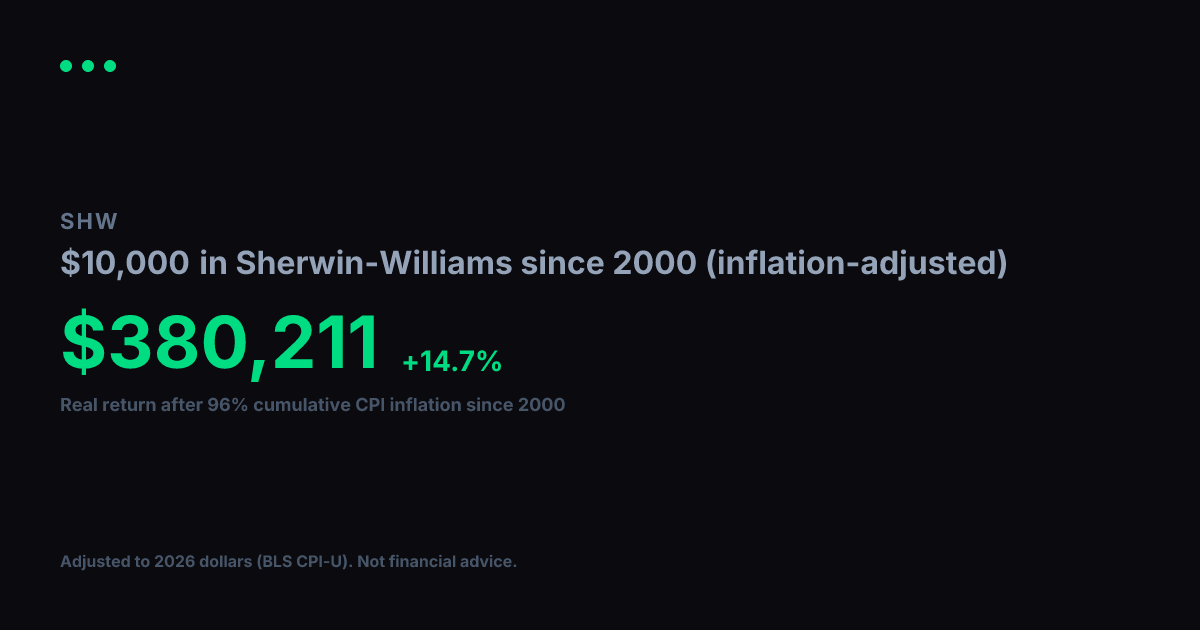
View nominal (non-adjusted) versionA $1,000 investment in Sherwin-Williams in 2000 grew to $87,166 in nominal terms. But 2000 dollars had 96% more purchasing power than today. After adjusting for cumulative inflation using BLS CPI-U data, the real value of that growth works out to $44,473 in constant 2000 dollars, equivalent to a +15.3% real annualized return.
Nominal final value
$87,166
+8616.6% total return
Real value (2000 dollars)
$44,473
+4347.3% real total return
Real annualized return
+15.3%
vs. +18.3% nominal annualized
Year-by-Year (Inflation-Adjusted)
$1,000 in Sherwin-Williams since 2000, values in constant 2000 dollars
| Year | Nominal Value | Real Value (2000 $) |
|---|---|---|
| 2000 | $1,000 | $1,000 |
| 2001 | $1,561 | $1,521 |
| 2002 | $1,652 | $1,576 |
| 2003 | $1,621 | $1,513 |
| 2004 | $2,097 | $1,904 |
| 2005 | $2,732 | $2,397 |
| 2006 | $3,408 | $2,904 |
| 2007 | $4,540 | $3,752 |
| 2008 | $3,824 | $3,043 |
| 2009 | $3,279 | $2,627 |
| 2010 | $4,465 | $3,485 |
| 2011 | $6,094 | $4,571 |
| 2012 | $7,141 | $5,246 |
| 2013 | $12,021 | $8,648 |
| 2014 | $13,741 | $9,745 |
| 2015 | $20,554 | $14,577 |
| 2016 | $19,560 | $13,672 |
| 2017 | $23,527 | $16,085 |
| 2018 | $32,626 | $21,640 |
| 2019 | $33,251 | $21,546 |
| 2020 | $44,349 | $28,284 |
| 2021 | $55,569 | $33,738 |
| 2022 | $69,589 | $38,700 |
| 2023 | $58,014 | $31,079 |
| 2024 | $75,378 | $39,227 |
| 2025 | $89,439 | $45,632 |
| 2026 | $89,349 | $45,586 |
Inflation adjustment uses BLS CPI-U annual data, deflated to 2026 dollars. Nominal stock data from Yahoo Finance (split-adjusted closing prices). Real values are expressed in constant 2000 purchasing-power dollars. For informational and educational purposes only. Not financial advice. Past performance does not guarantee future results. See our methodology and full disclaimer.